- Original Paper
- Open access
- Published:
Last mile delivery by drones: an estimation of viable market potential and access to citizens across European cities
European Transport Research Review volume 11, Article number: 30 (2019)
Abstract
Rapid technological developments in autonomous unmanned aerial vehicles (UAV or drones) and an evolving legislation may soon open the way for their large-scale implementation in the last mile delivery of products. The use of drones could drastically decrease labour costs and has been hyped as a potential disruptor to the parcel delivery industry. Online retailers and delivery companies such as Amazon, are already filing up patents for the development of multi-level fulfilment centres for unmanned aerial vehicles or “drone-beehives” that would allow the deployment of this technology within built environment. A substantial amount of research has been carried out in the last years on the potential use of drones for parcel delivery, principally in the area of logistic optimisation. However, little is known about the potential market and economic viability of such services in Europe. This paper presents a modelling framework using EU-wide high-resolution population and land-use data to estimate the potential optimal location of drone-beehives based on economic viability criterion. It estimates the potential number of EU28 citizens that could potentially benefit from last mile-drone delivery services under four scenarios. The performed analyses indicates that under the scenario considered as the most technologically realistic, up to 7% of EU citizens could get access to such services. When considering technological improvements scenarios, the share reaches 30%. Furthermore, results suggest that due to the differences in population and land-use patterns in the different Member States, the potential drone coverage across Europe could be very heterogeneous, with the UK, Germany, Italy and France appearing as the most likely countries where drone-beehives may have the most efficient development.
1 Introduction
Transport is one of the main pillars of modern economies comprising a spectrum of individual systems and their interconnections that are intended to cover the mobility demand of people and goods. Transport systems include an extensive series of physical and organisational elements and are being characterised by an overall intrinsic complexity. These elements can be influencing each other directly and/or indirectly, linearly or nonlinearly, having also potential feedback cycles [1]. In particular, new technologies and transport trends add new levels of interaction with the society and users and may have considerable influence on people mobility and freight transport services. In principle, the transport sector is intrinsically a very dynamic sector, even though conventional transport modes are nowadays consolidated, with mostly evolutionary improvements for what regards their capacity, efficiency, safety, and reliability in the last years. However, transport is also strongly linked to broad societal changes emerging from the ever-changing economies and the geopolitical situation: the global economic crisis, limited resources and new vulnerabilities and uncertainties have a direct impact on the way people and goods move. Within this context, urban freight transport (UFT) is a relevant part of modern cities. It is associated to economic advantages that contribute to well-being but it also generates social costs [2]. So far, more research on UFT and policy interventions have been conducted in Europe, with European cities having to face bigger last-mile challenges due to in general denser urban situations and stricter limits on the use of large trucks in comparison e.g. to the United States [3].
E-commerce, facilitated by the social media marketing, has grown rapidly over the past years. In 2016, the online retailer Amazon was reported to serve 310 million customers worldwide [4]. In Europe, the number of online shoppers can be estimated between 300 and 340 million (estimated by Amazon [5]) and 450 million (calculated from numbers provided by Brohan [6]). As the majority of goods purchased online are delivered directly to customers, last mile delivery (referring to the movement of goods from a transportation hub to their final destination) has become fundamental to this industry. Home deliveries are inefficient due to the spatial dispersion of residences and the frequency of failed deliveries [3] and the cost of delivering parcels represents a significant expenditure for online retailers. For the past 10 years, economic figures reported by Amazon in the US have shown an increasing disproportion between outbound shipping cost and shipping revenue [7]. It is therefore no surprise that the problem of the last mile delivery is now bringing together solutions combining recent developments in Information and Communication Technologies (ICT), Intelligent Transport Systems (ITS), Industry 4.0 and new transport vehicles [8] with the aim to decrease costs. Various solutions, taking into consideration e-consumers’ preferences are being investigated. Among them, automatic delivery stations (lockers) have the potential to reduce home delivery problems (such as missed deliveries) adding advantages such as flexible pick-up time, no missed-deliveries and less travelled kilometres for delivery service providers [9]. Such solutions, already implemented in several countries, may be preferred in dense urban centres where public transport is available. However their associated potential unwanted effects of increasing the number of private vehicles trips to collect the parcels [9] may make them less convenient both in already heavily congested cities and in suburban areas where people are more dependent on cars to move around.
Within this last point, the idea of using Unmanned Aerial Vehicles, or drones, for last mile delivery is gaining popularity. The use of drones to deliver parcels may have the potential to decrease delivery costs, having no driver or truck costs, eliminating congestion costs, having less missed-deliveries due to the very short delay, e.g. 30 min [10] between item dispatch and delivery, and is now the object of intense research activities [11,12,13,14,15,16,17,18,19,20,21]. Drone delivery may bring other significant advantages. From a consumer preference point of view, drone delivery combined with mobile phone applications to ensure traceability and scheduling, could provide conditions to satisfy highest demand probability [9] (combining home delivery with flexible delivery time, information traceability and reduced cost). Drone delivery could also reduce the need for local transport and decrease congestion and air emissions. Some potential issues have also been raised in term of the safety of drones to people and noise (that could potentially be addressed by active noise cancelling [22] or bladeless systems [23]).
Some limitations relative to the use of drone delivery services have been raised particularly for the need to relocate or build new distribution centres closer to customers [14]. A recent patent filled-up by Amazon Technology Inc. [24] for a fulfilment centre (Fig. 1) designed to accommodate landing and take-off of unmanned aerial vehicles in densely populated areas (from here on referred to as drone-beehives) seems to confirm the industry is giving more serious consideration to this delivery alternative.

Amazon drone-beehive concept (source: Curnlander et al., 2017) [24]
However, some authors have also suggested that the current hype for drones could lead to false expectations and that the drone delivery concept may not pass the economic viability test. According to the Gartner hype cycle [25], drones spanned the “peak of inflated expectations” in just 1 year, and in 2017, they were about to enter the “trough of disillusionment” [26].
Finally, any innovative logistics solutions should be integrated inside the concept of city logistics [27] considering traffic environment, congestion, safety, and energy savings, and by engaging different stakeholders within the framework of the market economy. The same can be said for the location of urban distribution centers that define the last mile segment: their location should be set by optimizing both long distance freight provision and last mile delivery routings to retailers (including restocking) incorporating economic, environmental and social criteria and constrains [27]. Drone beehives could be established as joined delivery systems where different freight carriers could cooperate to jointly deliver goods to customers and potentially also collect from retailers following a structure presented by Taniguchi [27]. Furthermore, lifecycle analysis should be applied to drone manufacturing and use, as identified in Taniguchi et al. [28], to assess the environmental impact of this technology compared to traditional van delivery.
This paper aims to provide a reality check to the viability of the drone delivery concept. It investigates the potential optimal location of “drone-beehives”, such as the one patented by Amazon and their potential economic viability as a function of the density of reachable population (living at a density low enough to have access to a private landing area i.e. private garden). The objective is to estimate how many EU customers could potentially benefit of this service under and range of different hypothesis. This paper is, to the best of the authors’ knowledge the first to investigate this potential across the EU. The results of this analysis could be incorporated as a possible solution for specific cities as part of further integrated decision support system methodologies (such as proposed by Gatta et al. [2] or Nuzzolo and Comi [29]), as well as for ex-ante policy evaluation [30], to help experts and local authorities develop, evaluate and facilitate appropriate freight and last mile delivery plans for cities.
After a literature review focusing primarily on the drone last mile delivery and pertinent legislative and policy documents in section 2, Section 3 provides an outline of the potential market for the delivery model. Section 4 focuses on modelling hypothesis and details, while, Section 5 provides the model outcomes.
2 Context
The present section provides a brief literature review on the drone last mile delivery, in particular for what concerns the technological, political and legislative context, which are critical to this study.
Literature on drones has been thriving in the last years. Hassanalian and Abdelkefi [31] provide a taxonomy of drones and propose and discuss solutions for different design challenges, including the importance of swarm flight. Rao et al. [32] present recommendations on societal challenges from the implementation of drones, on safety, security, privacy, ownership, liability, and regulation. De Miguel Molina and Seggara Oña [33] provide an overview of the drone industry in Europe, including data of manufacturers, revenues and forecast.
Drone last mile delivery is an interesting research topic with real world applications appearing very fast. McKinsey identifies autonomous unmanned aerial vehicles (UAVs) as a dominant option for last mile deliveries, especially of parcels, for (rural) areas with density smaller than 50.000 inhabitants, especially since it is expected that same-day or instant delivery will grow in the future [34]. Home delivery by drones is being promoted and researched by a growing number of firms. Companies such as Amazon, Google, UPS, DHL, and others have tested drone delivery for years, some since 2005, as a possible alternative or complement to traditional delivery [11]. More recently, Amazon [18] is planning to use drones for 30 min deliveries directly to home, and has begun private trials in England, with the first customer delivery by drone becoming a reality. Many start-up companies such as Skycart, Matternet [35] and FlyTrex [36] are also planning to offer drone delivery services.
On the issue of using drones for last mile delivery, Lohn [37] provides a technical overview of the impacts of delivery drone operations at a city scale and explores the areas of energy consumption, infrastructure requirements, aerial congestion, privacy, and noise. The KiM Netherlands Institute for Transport Policy Analysis [38] identifies parcel delivery as one of the three principal applications and market opportunities for drones in passenger and freight transport.
More specifically, in the last years, a number of authors deal with the “last mile” delivery problem from a transportation planning perspective. Murray and Chu [14] provide mathematical programming models for the optimal routing and scheduling of drones and delivery trucks for parcel delivery, including a scenario in which a drone works in collaboration with a traditional delivery truck to distribute parcels. Building on this study, more recently, Ha et al. [39] implement the objective of minimising operational costs including total transportation cost and costs created by waste time a vehicle has to wait for the other. Tavana et al. [21] discuss the truck scheduling problem (i.e. the optimal sequence of inbound and outbound trucks at a dock doors), considering drones instead of outbound trucks. Poikonen et al. [40] deal with the vehicle routing problem with drones dispatching from the top of trucks. The same topic is investigated in a more recent paper by Yurek and Ozmutlu [41], focusing on minimising the combined delivery completion time. Dorling et al. [15] derive and experimentally validate an energy consumption model for multirotor drones within a vehicle routing optimisation problem. More recently, Stolaroff et al. [16] focus on possible reduction of greenhouse gas emissions and energy use by using drones for last mile delivery, and provide policy recommendations to achieve environmental benefits, focusing on warehouse needs.
While research relative to overcoming technical limitation and developing logistics optimization algorithms is increasing, less work has been done in the area of optimal drone-beehive location and potential economic viability. Little is currently known about the potential population that could viably be reached by such services.
On emissions advantages of implementing delivery drones, Goodchild and Toy [17] provide a first attempt of estimating CO2 emissions and vehicle-miles travelled of two delivery models, one by trucks and the other by drones, using several ArcGIS tools and emission standards within a framework of logistical and operational assumptions. They identify general conditions under which drones are likely to provide a CO2 benefit. Figliozzi [42] addresses the contribution of drones in the reduction of CO2 emissions using analytical tools, accounting for scenarios for the average last mile delivery distance. Results from these previous studies clearly show that drones are significantly more efficient than a conventional diesel light commercial vehicle (LCV)-based delivery service in terms of both energy consumption and pollutant emissions on a per trip basis. However, considering the possibility for LCVs to serve several deliveries on the same route, drones performed better only in terms of life-cycle pollutant emissions and not in terms of CO2 and energy consumption. These analyses, however do not take into account the clear benefit brought by drones in removing vehicles from the road. This could lead to potentially significant reduction of congestion and travel time especially in the most densely populated areas where last-mile delivery associated with eCommerce services has increased the contribution of LCVs to road traffic [43]. Studies commissioned by the European Commission, identify challenges, issues and possible solutions for UFD and logistics [44] including drone operations in residential areas [45]. From a European Policy perspective the Strategic Transport Research and Innovation Agenda (STRIA) adopted by the EC in 2017 as part of the “Europe on the move” package highlights main transport research and innovation (R&I) areas and priorities for clean, connected and competitive mobility [46]. According to STRIA, drones represent the most relevant research and innovation actions leading to a successful deployment of highly competitive low-carbon connected and automated solutions in air transport, and represent a key enabler of electric aviation transport.
From a EU legislation perspective, the current regulation of unmanned aircraft systems (UAS), with a maximum take-off mass (MTOM) of less than 150 kg, falls within the competence of the Member States (MSs). A legislation is under development following an agreement endorsed by the EU, reached with the European Parliament, on Dec. 22, 2017 [47]. This would allow a high degree of flexibility from MSs to define zones in their territory, where either drones operations are prohibited or restricted (for example to protect sensitive areas), or where certain requirements are alleviated. In addition, it would allow the use of autonomous aircraft in the “specific” category, through a system that includes a risk assessment being conducted by the UAS operator before starting an operation, or an operator complying with a standard scenario, or an operator holding a certificate with privileges. The SESAR Joint Undertaking [48] provides an overview of national legislation, and follows the market evolution of drones in Europe identifying safety issues and sector opportunities. More recently, the European Commission supported by the European Union Aviation Safety Agency, adopted common EU-wide rules for the technical requirements for drones [49]. The implementation of common rules across the EU will set the limits from a safety perspective, but at the same time, will provide the framework that will help foster investment and innovation, allowing seamlessly drone business development and drone operation.
The US Federal Aviation Administration (FAA) has issued some rules since 2016 for small unmanned aircraft (UAS) operations that cover a broad spectrum of commercial and government uses for drones weighing less than 25 kg [50]. Nakamura and Kajikawa [51] evaluate the effectiveness of the current Japanese regulation for the safety of small unmanned aerial vehicles (UAVs) regulations in Japan, effective since 2015, in terms of both safety and contribution to the facilitation of innovation, concluding that there are vast margins for improvement.
Diverging from the existing literature, the present analysis does not focus on the potential economic, traffic-related or environmental benefits related to the introduction of last-mile delivery services based on drones, but it focuses on their practical feasibility considering the actual population and land-use pattern in Europe. The next section provides details on the modelling framework adopted to carry out the analysis.
3 Data and modelling assumptions
This study presents a modelling framework developed, to (1) identify the number of people present within the delivery range of potential drone-beehives across the EU and (2) calculate the costs and returns associated with delivering a parcel to each individual. This model uses a series of input data and assumptions that are provided below.
3.1 Input data
The analysis are performed using a EU28-wide, 100 m resolution gridded population and land-use data to identify the location of both potential customers and drone-beehives. This data was produced by the European Commission Joint Research Centre’s LUISA Territorial Modelling Platform [52] under the 2017 reference scenario, for the year 2015 [53] (process illustrated in Fig. 2 ). The LUISA Territorial Modelling Platform, previously referred to as EU-ClueScanner is described in detail in Lavalle et al. [54]. It is a forward-looking model used to assess impacts of European trends and policies with a territorial dimension on distribution of land uses and population across time and space. It models land use and local population density changes as a function of macro-level drivers (e.g. regional demographic, economic and climate scenarios) and local-level biophysical factors and dynamic accessibility by road network.

flowchart illustrating the production process of the land-use and population data used in our approach
The 2017 reference scenario makes use of a refined version of the 2012 CORINE Land Cover 2012 [55] dataset as its base map for land use in 2012. It was created using a method previously described by Batista e Silva et al. [56] and Rosina et al. [57] which combines additional sources of information (e.g. Copernicus high-resolution layers, the Urban Atlas, the European Settlement Map, OpenStreetMap) to enhance the spatial and thematic detail. The baseline population used by the LUISA platform is a version of the Geostat 2011 1 km population dataset [58] downscaled to 1 ha resolution using a method described by Batista e Silva et al. [59], which relates local population with urban fabric classes identified by the above mentioned land use map. Combining all this information, the LUISA platform uses dynamic allocation methods that spatially distribute the expected regional net population and land uses changes across 100 m grid cells, producing grid-level projections of land use and population in 5 year-intervals from 2015 to 2050.
The 2015 outputs of the 2017 reference scenario [53] are used, as a “best available” proxy for the current European population distribution, thereby allowing to account for the 5.5 million people increase reported by Eurostat between the last 2011 EU population census and 2015.
3.2 Modelling assumptions
The performed analysis is based on the following sets of assumptions regarding delivery drones:
-
Drones used for delivery are similar to the Amazon Prime Air model [10] requiring a surface of “open space” to land (Fig. 3 ). As a proxy to estimate the availability of open landing space (gardens, etc.), a population density threshold of 115 person/ha is used. This threshold was selected by visually relating the outputs of the LUISA population map with typical sub-urban areas identified from aerial imagery in France and the UK. A more complex approach using remote sensing model algorithms in combination with high-resolution datasets of green and built-up areas, from the Global Human Settlement Layer, was also explored but produced very similar results.
-
Drones are allowed to fly above residential area and cities, thus, no legislative block is imposed. This is in line with the uncertainty concerning future legislation, and possible amendments that could focus on the creation of drone networks.
-
Delivery would occur directly from the drone-beehive to the customer, thus, no multiple deliveries are foreseen. This assumption fully conforms to the Amazon prime delivery model.
-
The drones can travel a maximum distance of 24 km (thus, 12 km one way). This distance is in line with the improved Amazon Prime Air model [60] and exceeds the first estimations used in Murray and Chu [14].
Fig. 3 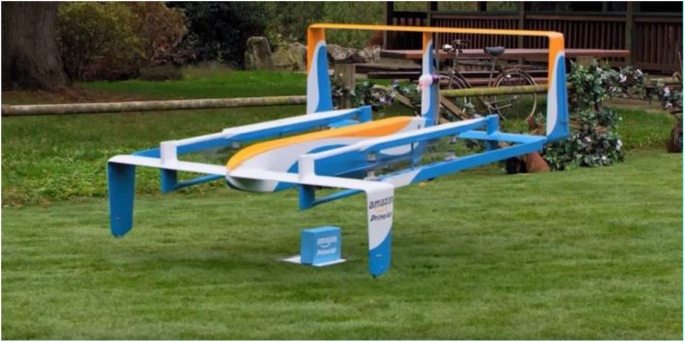
Amazon Prime Air drone delivery prototype [10]

Regarding the drone-beehives specification, the following assumptions are made:
-
Only pixels of land-use classes corresponding to commercial/industrial and abandoned commercial/industrial sites are suitable to host potential drone-beehives so as not to compete with the residential market and to benefit from higher accessibility (commercial/industrial sites are often located near major roads).
-
The necessary building permit is granted for the construction of drone-beehives (regardless of surrounding land-uses or building zones).
-
A one-hectare pixel would be large enough to accommodate a drone-beehive (no need of multiple adjacent pixels).
-
Each drone-beehive can host a sufficient number of drones and has the capacity to dispatch them sufficiently quickly to satisfy the delivery demand. The authors estimate (see section 5 for details) that drone-beehives may need a maximum of about 100 drones and a maximum launching capacity of 2 drones per minute.
4 Description of the model
The modelling approach is composed of two steps, which are run in sequence multiple times.
-
The first step creates a EU28 wide map, which associates to each pixel of industrial land-use the potential economic return resulting from the delivery of a fixed-price item to all people located within the drone delivery distance.
-
The second step identifies the pixels with the highest economic return and allocates drone-beehives to these locations. It also removes the population “served” by these warehouses from the map used as input in the next iteration of step 1.
4.1 Step 1 - estimation of maximum return
The following formula is used to calculate for each cell (raster pixel of one hectare) of industrial land-use the Euclidian distance to populated cells (falling below the chosen threshold) within a specified buffer distance. It then calculates the potential economic return of a delivery to each person assuming the following function:
Where:
-
n is the number of populated cells within a circles of a radius equal to BufferDistance around the target industrial cell
-
Popcell i is the number of people living in a specific populated cell i.
-
ItemPriceMargin is the realized benefit on an item to be delivered. Assuming drone delivery would be performed mostly for low weight (< 2.3 kg [10]) high value items (value > 100 EUR, such as electronic devices, shoes, etc), the ItemPriceMargin is estimated to 20 euro. This margin, representing 20% of the sale price is slightly higher than the 15% charged by Amazon as referral fee [61].
-
FixCost is the fixed cost for the delivery of a single parcel, including box and handling. It is assumed to be equal to 1 euro.
-
MaxDeliveryCost is the maximum cost of a delivery if the drone travels the maximum distance. It is assumed to be equal to 1 euro.
-
BufferDistance is the maximum flying delivery distance of the drone.
-
DistanceToCelli is the Euclidian distance separating the populated cell i of interest from the target industrial cell.
It should be observed that the estimations of FixCost and MaxDeliveryCost as 1 euro each are conservative “educated guesses”. These numbers were chosen to account for the fact that costs, allowing each drone-beehive to be viable on its own, would likely be higher than the $0.88 per delivery reported by Keeney [62], corresponding to the potential averaged cost across the whole industry, inclusive economies of scales.
Figure 4 illustrates the modelling approach, which sums-up the maximum potential return for each pixel of industrial land-use assuming it could deliver parcels to all people within the specified drone delivery distance.

Illustration of the computational approach
Figure 5 provides the outputs of the model in the form of a map of potential return at EU28 scale.

Return map for the EU28: maximum potential return associated with cells of industrial land-use
4.2 Step 2 - identification of optimal hive allocation and update of the population input map
The allocation of hives follows a “selfish” approach, where each individual hive maximises its own benefit (rather than the system benefit). This behaviour, which is considered as the most realistic, is modelled using the return map created in Step 1, through the following steps:
-
Identification of the point of highest return in each Functional Urban Area (FUA) [64] (on at a time). It is assumed that hives with the highest economic return “settle” first and remove the population within their delivery radius from the accessible pool of customers for other potential hives. In case the buffer overlaps (small FUA), only the hive with the highest return (within that specific FUA) is kept and used for a second round of optimization.
-
Creation of a circular buffer of radius equal to the drone delivery distance and removal (from the population map used by step 1) of populated pixels within the buffer.
Steps 1 and 2 are then run successively for multiple iterations until no new hive exceeding a specific economic viability threshold (see Section 5) is identified.
The flowchart in Fig. 6 depicts the process.

Flowchart of the process for allocating beehives
The choice of allocating drone bee-hives within Functional Urban Areas (consisting of city cores and commuting zones) is made for 2 reasons: (1) In 2009 over 60% of the EU population lived in FUA [63]; (2) due to the limited range of drones their area of delivery was likely inferior to that of FUAs.
4.3 Financial return calculation
The maximum return associated with drone hives identified by the modelling approach assumes that for each year one parcel is delivered to every person within the drone delivery range. In order to derive a more realistic financial return associated with the operation of drone-beehives, a scaling factor is calculated based on the following hypotheses:
-
Online buyers are distributed uniformly across all EU28 countries (excluding islands);
-
10% of online buyers would use drone air delivery once per year (similar buying frequency as per de Oliveira’s assumption [9]).
Using a conservative 300 million estimate of online buyers and a total EU28 “continental” population of 500 million, this scaling factor is estimated equal to 0.06.
This scaling factor was applied to calculate the estimated return from the value calculated by the modelling approach. Figure 7 illustrates the results from the modelling and estimation of financial return for potential drone-beehives for the functional urban area of London in the UK. The hive location and financial return is calculated using a 12 km drone flight distance and a 115/ha population threshold. Circles with yellow outer lines represent the range covered by drones around each hive. Hives, which range areas are trimmed by the range of others indicate that a proportion of potential customers within their servicing area has already been allocated to a hive of higher economic return.

Hive location and financial return around London, UK for a 12 km done flight distance and a 115/ha population threshold
4.4 Scenario investigation
Four possible scenarios are considered in the analyses:
-
Scenario 1: 12 km flight distance and 115/ha population landing threshold. This represents the most realistic scenarios under the current technical limitations.
-
Scenario 2: 12 km flight distance and 130/ha population landing threshold. This represents a possible scenario achievable through an improvement of the drone landing capacity (improvement of the software to land in smaller gardens).
-
Scenario 3: 12 km flight distance and no landing threshold. This scenario, currently unrealistic, correspond to the best that could be achieved by investing in software (no improvement in the drone flight distance). With this scenario, parcels can be delivered to anyone regardless of the necessity to land in a specific place.
-
Scenario 4: 24 km flight distance and 115/ha population landing threshold. This scenario, also currently unrealistic, corresponds to an investment in hardware allowing the doubling of the current flight range of drones without any software improvement.
5 Results
For each scenario, the relationship between the numbers of people potentially within reach of drones (from the selected drone-beehives) is investigated, related to their economic viability threshold (the minimum economic return above which the drone delivery activity was considered viable) at the EU28 scale (Fig. 8).

Number of people having access to service as a function of economic viable threshold of drone-beehives
It can be observed that at the EU28 scale, the four considered scenarios follow a similar pattern, and lower economic viability thresholds allow the provision of service to a larger portion of the population. Scenario 1 provided the lowest access to potential customers while Scenario 4 provided the highest level of coverage across most economic viability thresholds. This indicates that doubling the flight distance of drones, something new developments in lithium-ion batteries could make possible within the next decade [65], would provide a higher level of customer coverage to what could be achieved by reaching high-density customers in city centres and apartment buildings.
It is also observed that among the considered scenarios, the difference in the number of people that could have access to drone delivery services remains relatively stable across the various economic viability thresholds. For example, the difference in populations reachable by drone among scenarios 1 and 4 remains close to 90 million for economic viability thresholds ranging from 500 thousand to 900 thousand euro.
To identify a realistic economic viability threshold for hives, a simple analysis has been conducted, across the four considered scenarios, for one of the hives identified as most profitable located near Paris (France). The potential costs has been estimated for building the warehouse and equipping it with enough drones to satisfy demand (assuming each drone could deliver one item per hour) and the equivalent 10-year return rate on that investment for different hive annual return thresholds has been calculated.
Hive costs were calculated based on the formula below:
Where:
Warehouse cost: is the cost of the warehouse estimated here at 5 million euro. This figure was estimated as “best guess” relative to published number which, for a surface of 10,000 m2, vary between 72,000 euro (for a standard warehouse [66]) to 24 million euro (for Amazon’s most expensive fulfilment centre [67]).
Pop_in_range: total population reachable by drone departing from the hive.
Scaling_factor = 0.06 (assuming 10% of online buyers make use of the done service, see section 4.3).
Working_Days: number of days deliveries can occur = 365 days.
Working_Hours = number of hours per day when drone delivery can occur = 12 h.
Backup_fleet: percentage of extra drones that should be purchased to cover potential losses = 150%.
Drone_cost = 9000 euros (taken from [36]).
Based on the above formula the required drone fleet size for the Paris drone-beehive was estimated between 15 drones + 22 backup and 77 drones + 115 backup (to satisfy demand for delivery across all scenarios). This fleet size should be sufficient to accommodate peak demands such as reported by de Oliveira et al. [9], where 24% of customers would require home deliveries between 18:00 and 20:00 (translating into 21 to 109 drone trips per hour).
The correspondence, for each considered scenario, between 10-year return rates on investment and hive annual economic return are presented in Fig. 9. This analysis indicated that 650.000 euro was the minimum annual return threshold generating positive returns across the four scenarios. This estimation can be considered as a “conservative” economic viability threshold, since drone-beehives servicing less customers would likely require a smaller investment (requiring a smaller drone fleet) than the one considered here.

comparison of equivalent 10-year return rates on investment as a function of various hive annual economic return thresholds across the four considered scenarios
Using the economic viability threshold of 650.000 euro, the location, number of drone-beehives, population covered and the total economic return across the EU28 at member state level is identified (Table 1).
Comparing the results from Scenario 1 (using a 650.000 euro viability threshold) with the current location of existing warehouses from Amazon (Table 2) it is possible to observe a relatively good correspondence for the UK, Germany, Italy and France. However, this is not the case for Spain, which currently hosts six warehouses but would not be suitable for any drone-beehive, and the Netherlands, which would be suitable to 3 hives but currently does not host any warehouses.
Under the most likely scenario (Scenario 1) around 40 million EU citizens could benefit from drone delivery from 50 drone-beehives. If the constrain of the availability of landing site is removed (Scenario 3), this number could rise to 120 million and 96 viable drone-beehives. A doubling of the range of the drone with no improvement in landing capacity (Scenario 4) would increase the coverage to 150 million via 117 hives.
Looking at the Member State level for the different scenarios (Figs. 10, 11, 12, 13, 14, 15, 16 and 17) under a 650.000 euro economic viability threshold, it can be observed that the population coverage and the total estimated economic returns would significantly vary.

Spatial distribution of hives for Scenario 1 under six different economic viability thresholds

Percentage of population covered by drone service (left axis) and estimated return of drone delivery hives per country (right axis) for Scenario 1 and a 650,000-euro economic viability threshold

Spatial distribution of hives for Scenario 2 under 6 different economic viability thresholds

Percentage of population covered by drone service (left axis) and estimated return of drone delivery hives per country (right axis) for Scenario 2 conditions and a 650.000-euro economic viability threshold

Spatial distribution of hives for Scenario 3 under 6 different economic viability thresholds

Percentage of population covered by drone service (left axis) and estimated return of drone delivery hives per country (right axis) for Scenario 3 and a 650,000-euro economic viability threshold

Spatial distribution of hives for Scenario 4 under 6 different economic viability thresholds

Percentage of population covered by drone service (left axis) and estimated return of drone delivery hives per country (right axis) for Scenario 4 and a 650,000-euro economic viability threshold
Under Scenario 1 (Fig. 10), drone-beehives would be viable in only 13 EU countries but only the UK, Germany, France and Italy would generate returns higher than 5 million per year. In terms of population coverage, the UK and Ireland would benefit the most, with drone service potentially reaching 20% of the countries’ population (Fig. 11).
Under Scenario 2 (Fig. 12), drone-beehives would be viable in 15 EU countries. The improvement in drone landing capacity (to a density of 130 person/ha) would make drone delivery viable in Austria and Belgium. Just as in Scenario 1, only the UK, Germany, France and Italy would generate return higher than 5 million per year. In terms of population coverage, this scenario would lead only to marginal increases with the UK and Ireland remaining the only countries reaching 20% coverage (Fig. 13).
Under Scenario 3 (Fig. 14), drone hives would become viable in 21 EU countries. The removal of landing restrictions would make drone delivery viable in Romania, Hungary, Spain, Latvia, Bulgaria and the Czech Republic. Under this scenario, estimated return would exceed 10 million in the UK, Germany, France, Spain and Italy and 6 million in Poland. In terms of population coverage, Ireland would see no noticeable increase, remaining at 20% while the UK would exceed 30%. This new scenario would also lead to population coverages exceeding 30% in Greece and Latvia and 20% in Spain (28%), Denmark, Austria, Portugal, Belgium, the Netherlands, France and Germany (Fig. 15).
Under Scenario 4 (Fig. 16), drone hives would become viable in 20 EU countries (Luxembourg, which drone-beehive range would extend into France is not shown in Fig. 17). The doubling of the flight distance of the drone would make drone delivery viable in Romania, Hungary, Spain, the Czech Republic, Austria and Belgium compared to Scenario 1. Under this scenario, estimated return would reach almost 40 million in the UK, 30 million in Germany, 20 million Italy and 15 million in France. This scenario would also lead to population coverages exceeding 50% in the UK, the Netherlands and Belgium (Fig. 17).
6 Discussion and conclusions
Figures 18 and 19 summarise respectively the population covered and the estimated return for Germany, Spain, France, Italy, the Nederland, and the U.K. under the four scenarios. The outcomes of this study strongly suggest that across the four scenarios considered the operation of drone delivery would consistently be most economically viable in the UK, Germany, France and Italy. The presence of existing warehouses of online retailers in these four countries (see Table 2) further supports the idea that drone hives could viably be operated there.

Population covered (%) under the four scenarios: the case of Germany, Spain, France, Italy, The Nederland, and the U.K

Estimated return under the four scenarios: the case of Germany, Spain, France, Italy, The Nederland, and the U.K
Under the most realistic scenario considered (Scenario 1) drone delivery from drone-beehives could reach a population of 40 million people (about 7.5% of the EU28 population) spread unevenly across 13 European countries. The population that could most highly benefit from this service would be in the UK and Ireland (reaching a 20% population coverage).
The comparison of the effects of potential future development in software, allowing delivery to higher densities (Scenario 3) or hardware, allowing to double the delivery range (Scenario 4) indicate that investments in hardware would result in higher economic returns and more population covered (up to 27% of the EU population). However, such investment would lead to higher variations of service across Europe (9 countries with more than 20% of their population covered) compared to efforts to deliver by drones at any density (12 countries with more than 20% of their population covered).
In light of these results and considering that the enormous technical challenges associated with the delivery of parcels in areas of very high population density (allowing the drone to deliver to apartment windows for example), developments in line with Scenario 4 are more likely in the future (assuming legal hurdles for drone delivery are resolved).
Some additional considerations can be made. The results from the analysis are strongly dependant on the hypotheses underlying the used approach, in particular, on the values selected for Item Price Margin, warehouse cost and percentage of online customers using drone-delivery. However, changes in the Item Price Margin from 20 euro to 3.5 euro (closer to what online sellers such as Amazon receive from an average item (15% of 23.2 euro [68]) produced, for the same scenario, similar distribution maps across Europe. Figure 20 provides a visual comparison between both scenarios. It can be observed that the location of most warehouses are within close distance to each other (indicated by the overlapping icons) except near Southampton where the warehouse for the 3.5 euro return shifted slightly North West.

Comparison in the spatial distribution of drone-beehives for Scenario 1 between an Item Price Margin of 20 euro and 10% reach of potential customers (large circles) and an Item Price Margin of 3.5 euro and 65% reach of potential customers (small circles), for the area of London
This change also produced similar country rankings in terms of their estimated returns for drone delivery activities (for example drone delivery in the UK would be the most profitable followed by Germany, France and Italy for Scenario 1). Of course, in order to remain viable at such low return per item delivered, the number of customer reached would need to increase from the 10% assumed in this study to numbers closer to 63% (proportion at which the drone-beehive near Paris could achieve similar returns). Due to the increase in the number of drones necessary to deliver to such large number of customers, the minimum viable economic threshold would also need to increase to 900.000 euro. Along the same line, an increase in the cost of warehouse building from the current 5 million to the maximum of 24 million would shift the minimum economic viability thresholds from 650,000 euro to 3.1 million (20 euro Item Price Margin, 10% customer reached) or 3.3 million (3.5 euro Item Price Margin, 63% customers reached).
In spite of the above-mentioned limitations, the modelling approach used in the present study is robust enough to identify some broad trends. It points to the viability of drone-beehives in many European urban areas, and therefore such types of activities are likely to develop quickly, especially if regulatory measures regarding drone flights will seamlessly enable this kind of services. Such an event has the potential to disrupt the current last mile delivery industry with potential consequences also on socioeconomic factors (e.g. jobs). Furthermore it could further increase the disparities between dense urban and other urban areas and across Member States having access to service and developing expertise and skills in this new area. This seems to point out to a potential polarisation of technology usage with the risk of entire countries being left behind due to lack of market or low financial viability.
Further applications of this approach for specific cases may be able to incorporate elements, such as local land prices, labour costs (which would affect warehouse costs) or the local proportions of online shoppers, GDP or age groups, housing types (which would impact our scaling factor), and provide more refined results and disaggregated scenario analysis more adapted to particular locations.
Some of this highly disaggregated data (particularly related to client profile and online behaviour) may readily have been collected and available to large online retailers (provided user consent was obtained). However, other less established companies may have more difficulties accessing this type of data, which may decrease opportunities for competition. For research purpose, micro data, relative to online-shopping behaviour (already available from Eurostat), could be combined with other publicly available high resolution data sources (such as for example the French “IRIS” layer which provides disaggregated socio-economic information at the neighbourhood level) and population gird maps (such as used in this study) to provide a sufficient level of disaggregation. The inclusion of additional elements in the EU-barometer could also help decrease the current knowledge gaps relative to customer acceptance of drone delivery technology.
As complement to this study, further studies, making use or more advanced operation research approaches, such as facility location problem (using for example objective function optimisation) or p-median problem, may explore the identified trends in more detail at a local level. Using highly disaggregated data they could also investigate different scenarios such as the presence of recharging stations (locations where drones could change battery), or options combining drone home delivery with automated lockers at public transport stops or shopping centres. More modelling work, such as performed by Musolino et al. [69] could also be incorporated to adjust the optimal location of drone-beehives by including long distance logistic optimization.
Finally, it should be emphasised that, while the development of drone-beehives for last mile delivery may already be viable, the setup of such distribution centres would require important industry and public involvement. Such consultations would be particularly important, considering the novelty of drone delivery, to address concerns and policy implications in terms of safety, environmental nuisance, urban planning, air traffic, city logistic, and employment in the delivery industry.
Availability of data and materials
The datasets used and/or analysed during the current study are available from the corresponding author on reasonable request.
References
Cascetta, E. (2001). Transportation systems engineering: Theory and methods.
Gatta, V., Marcucci, E., & Le, P. M. (2017). Smart urban freight planning process : Integrating desk , living lab and modelling approaches in decision-making. European Transport Research Review, 9, 1–11. https://doi.org/10.1007/s12544-017-0245-9.
Giuliano, G., O’Brien, T., Dablanc, L., & Holliday, K. (2013). REPORT 23 synthesis of freight research in urban transportation planning.
Statista (2018) Statistics and Facts about Amazon | Statista. https://www.statista.com/topics/846/amazon/. Accessed 21 June 2018.
Amazon (2018) Sell in Europe grow your business selling online to loyal Amazon customers.
Brohan M (2015) Amazon builds up its european marketplace. https://www.digitalcommerce360.com/2015/04/30/amazon-builds-its-european-marketplace/. Accessed 21 June 2018.
Statista (2018) Amazon ’ s shipping revenue and outbound shipping costs from 2006 to 2016 ( in. https://www.statista.com/statistics/236503/amazons-annual-shipping-revenue-and-outbound-shipping-costs/. Accessed 21 June 2018.
Ranieri, L., Digiesi, S., Silvestri, B., & Roccotelli, M. (2018). A review of last mile logistics innovations in an externalities cost reduction vision. Sustain, 10, 1–18. https://doi.org/10.3390/su10030782.
de Oliveira, K. L., Morganti, E., Dablanc, L., & Lúcia, R. (2017). Analysis of the potential demand of automated delivery stations for e-commerce deliveries in Belo Horizonte , Brazil. Res Transp Econ, 65, 34–43. https://doi.org/10.1016/j.retrec.2017.09.003.
Amazon Inc (2018) Amazon Prime Air. https://www.amazon.com/b?node=8037720011. Accessed 26 June 2018.
Lee HL, Chen Y, Gillai B, Rammohan S (2016) Technological disruption and innovation in last-mile delivery. Stanford Bus 1–26.
Sudbury, A. W., & Hutchinson, E. B. (2016). A cost analysis of amazon prime air ( drone delivery ) (Vol. 16, pp. 1–12).
Yoo, W., Yu, E., & Jung, J. (2018). Telematics and Informatics Drone delivery : Factors a ff ecting the public ’ s attitude and intention to adopt (Vol. 35, pp. 1687–1700). https://doi.org/10.1016/j.tele.2018.04.014.
Murray, C. C., & Chu, A. G. (2015). The flying sidekick traveling salesman problem: Optimization of drone-assisted parcel delivery. Transportation Research Part C: Emerging Technologies, 54, 86–109. https://doi.org/10.1016/j.trc.2015.03.005.
Dorling, K., Heinrichs, J., Messier, G. G., & Magierowski, S. (2017). Vehicle routing problems for drone delivery. IEEE Transactions on Systems, Man, and Cybernetics - Part A: Systems and Humans, 47, 70–85. https://doi.org/10.1109/TSMC.2016.2582745.
Stolaroff, J. K., Samaras, C., O’Neill, E. R., et al. (2018). Energy use and life cycle greenhouse gas emissions of drones for commercial package delivery. Nat Commun, 9, 1–13. https://doi.org/10.1038/s41467-017-02411-5.
Goodchild, A., & Toy, J. (2017). Delivery by drone: An evaluation of unmanned aerial vehicle technology in reducing CO2emissions in the delivery service industry. Transportation Research Part D: Transport and Environment, 61, 58–67. https://doi.org/10.1016/j.trd.2017.02.017.
Singireddy, R. S. R., & Daim, T. U. (2018). Technology Roadmap : Drone Delivery – Amazon Prime Air. In T. Daim & C. L. EJ (Eds.), Infrastructure and Technology Management. Innovation, Technology, and Knowledge Management (pp. 387–412). Cham, Switzerland: Springer.
Zorbas, D., Di Puglia Pugliese, L., Razafindralambo, T., & Guerriero, F. (2016). Optimal drone placement and cost-efficient target coverage. Journal of Network and Computer Applications, 75, 16–31. https://doi.org/10.1016/j.jnca.2016.08.009.
Kang, K.-S., & Jeon, I.-O. (2016). Study on utilization drones in domestic logistics service in Korea. Journal Distribution Science, 14, 51–57. https://doi.org/10.15722/jds.14.5.201605.51.
Tavana, M., Khalili-Damghani, K., Santos-Arteaga, F. J., & Zandi, M. H. (2017). Drone shipping versus truck delivery in a cross-docking system with multiple fleets and products. Expert Systems with Applications, 72, 93–107. https://doi.org/10.1016/j.eswa.2016.12.014.
Beard, P., Chell, C., Rapids, C., et al. (2016). Real-time noise reduction system for dynamic motor frequencies aboard an unmanned aeral vehicle (p. 1).
Red Dot (2019) Bladeless Drone. https://www.red-dot.org/project/bladeless-drone-26825/
Curnlander, J. C., Gilboa-Amir, A., Kisser, L. M., et al. (2017). Multi-level fulfilment center for unmanned aerial vehicles (Vol. 1).
Dedehayir, O., & Steinert, M. (2016). The hype cycle model: A review and future directions. Technological Forecasting Social Change, 108, 28–41. https://doi.org/10.1016/j.techfore.2016.04.005.
Gartner Inc. (2018). Gartner hype cycle. Cham: Gartner. http://www.gartner.com/technology/research/methodologies/hype-cycle.jsp. Accessed 21 June 2018.
Taniguchi, E. (2014). Concepts of city logistics for sustainable and liveable cities. Procedia - Social and Behavioral Sciences, 151, 310–317. https://doi.org/10.1016/j.sbspro.2014.10.029.
Taniguchi, E., Thompson, R. G., & Yamada, T. (2014). Recent trends and innovations in Modelling City logistics. Procedia - Social and Behavioral Sciences, 125, 4–14. https://doi.org/10.1016/j.sbspro.2014.01.1451.
Nuzzolo, A., & Comi, A. (2015). Urban freight transport policies in Rome : Lessons learned and the road ahead. Journal of Urbanism: International Research on Placemaking and Urban Sustainability, 8, 133–147. https://doi.org/10.1080/17549175.2014.884976.
Le Pira, M., Marcucci, E., Gatta, V., et al. (2017). Towards a decision-support procedure to foster stakeholder involvement and acceptability of urban freight transport policies. European Transport Research Review, 9. https://doi.org/10.1007/s12544-017-0268-2.
Hassanalian, M., & Abdelkefi, A. (2017). Classifications, applications, and design challenges of drones: A review. Progress in Aerospace Science, 91, 99–131. https://doi.org/10.1016/j.paerosci.2017.04.003.
Rao, B., Gopi, A. G., & Maione, R. (2016). The societal impact of commercial drones. Technology in Society, 45, 83–90. https://doi.org/10.1016/j.techsoc.2016.02.009.
de Miguel Molina, B., & Seggara Oña, M. (2018). The drone sector in Europe. In M. de Miguel Molina & V. S. Campos (Eds.), Ethics and civil drones (p. 92). Cham: Springer.
Joerss, B. M., Neuhaus, F., & Schroder, J. (2016). How customer demands are reshaping last-mile delivery. The McKinsey Quarterly, 17, 1–5.
Tracxn (2015) Tracxn report : Drones. https://www.slideshare.net/Tracxn/tracxn-drones-startup-landscape
Flytrex (2018) The right drone for your mission. http://www.flytrex.com/. Accessed 18 Sept 2018.
Lohn, A. J. (2017). What's the Buzz? The City-Scale Impacts of Drone Delivery. Santa Monica: RAND Corporation. https://www.rand.org/pubs/research_reports/RR1718.html.
KiM Netherlands Institute for Transport Policy Analysis (2017) Drones in passenger and freight transport. The Hague.
Ha, Q. M., Deville, Y., Pham, Q. D., & Hà, M. H. (2018). On the min-cost traveling salesman problem with drone. Transportation Research Part C Emerging Technologies, 86, 597–621. https://doi.org/10.1016/j.trc.2017.11.015.
Poikonen, S., Wang, X., & Golden, B. (2017). The vehicle routing problem with drones: Extended models and connections. Networks, 47, 26–36. https://doi.org/10.1002/net.
Es Yurek, E., & Ozmutlu, H. C. (2018). A decomposition-based iterative optimization algorithm for traveling salesman problem with drone. Transportation Research Part C Emerging Technologies, 91, 249–262. https://doi.org/10.1016/j.trc.2018.04.009.
Figliozzi, M. A. (2017). Lifecycle modeling and assessment of unmanned aerial vehicles (drones) CO2e emissions. Transportation Research Part D: Transport and Environment, 57, 251–261. https://doi.org/10.1016/j.trd.2017.09.011.
Allen, J., Piecyk, M., Piotrowska, M., et al. (2017). Understanding the impact of e-commerce on last-mile light goods vehicle activity in urban areas: The case of London. Transportation Research Part D: Transport and Environment, 61, 325–338. https://doi.org/10.1016/j.trd.2017.07.020.
Limited MT, CTL (2012) DG MOVE European Commission: Study on Urban Freight Transport.
van der Bossche, M., Maes, J., Vanelsander, T., et al. (2017). Logistics schemes for E-commerce. Brussels.
European Commission (2017) Towards clean, competitive and connected mobility: The contribution of transport Research and Innovation to the Mobility package SWD/2017/0223 final.
EASA (2018) Drones - regulatory framework background. https://www.easa.europa.eu/easa-and-you/civil-drones-rpas/drones-regulatory-framework-background. Accessed 21 June 2018.
SESAR Joint Undertaking (2016) European drones outlook study.
European Commission (2019) Commission delegated regulation (EU) on unmanned aircraft systems and on third-country operators of unmanned aircraft systems.
Federal Aviation Administration (2016) Operation and certification of small unmanned aircraft systems.
Nakamura, H., & Kajikawa, Y. (2018). Regulation and innovation: How should small unmanned aerial vehicles be regulated? Technological Forecasting and Social Change, 128, 262–274. https://doi.org/10.1016/j.techfore.2017.06.015.
Lavalle, C., Silva, F. B. E., Baranzelli, C., et al. (2016). Land Use and Scenario Modeling for Integrated Sustainability Assessment. In J. Feranec, T. Soukup, G. Hazeu, & G. Jaffrain (Eds.), European Landscape Dynamics CORINE Land Cover Data (p. 26). Boca Raton: CRC Press.
Jacobs-Crisioni, C., Diogo, V., Perpiña Castillo, C., et al. (2017). The LUISA Territorial Reference Scenario: A technical description. Luxembourg.
Lavalle, C., Baranzelli, C., e Silva, F. B., et al. (2011). A high resolution land use/cover modelling framework for Europe: Introducing the EU-ClueScanner100 model. In B. Murgante, O. Gervasi, A. Iglesias, et al. (Eds.), Computational science and its applications - ICCSA 2011 (pp. 60–75). Berlin, Heidelberg: Springer Berlin Heidelberg.
Copernicus Srervices (2012) CORINE LAND COVER. http://land.copernicus.eu/pan-european/corine-land-cover/clc-2012. Accessed 10 July 2018
Batista e Silva, F., Lavalle, C., & Koomen, E. (2013). A procedure to obtain a refined European land use/cover map. Journal of Land Use Science, 8, 255–283. https://doi.org/10.1080/1747423X.2012.667450.
Rosina, K., Batista e Silva, F., Vizcaino-Martinez, P., et al. (2018). An improved European land use / cover map derived by data integration. In Proceedings of the AGILE 2018: 21st conference of geo-information science (pp. 1–6). Lund.
EUROSTAT (2018) GEOSTAT. http://ec.europa.eu/eurostat/web/gisco/geodata/reference-data/population-distribution-demography/geostat. Accessed 10 July 2018
Batista e Silva, F., Gallego, J., & Lavalle, C. (2013). A high-resolution population grid map for Europe. Journal of Maps, 9, 16–28. https://doi.org/10.1080/17445647.2013.764830.
Johnson L (2017) No Title 9 things you need to know about the Amazon prime air drone delivery service. http://www.digitalspy.com/tech/feature/a820748/amazon-prime-air-drone-delivery-service/. Accessed 19 Feb 2018.
Amazon inc (2018) Selling on Amazon fee schedule referral fees selling on Amazon subscription fee per-item fees. https://sellercentral.amazon.fr/gp/help/external/help.html?itemID=200336920&language=en-GB&ref=efph_200336920_relt_11621. Accessed 9 Feb 2018.
Keeney T (2019) How can Amazon charge $ 1 for drone delivery ? https://ark-invest.com/research/drone-delivery-amazon. Accessed 12 Mar 2019.
Poelman, L., & Dijkstra, H. (2015). European cities – The EU-OECD functional urban area definition. Cham: Eurostats https://ec.europa.eu/eurostat/statistics-explained/index.php?title=Archive:European_cities_%E2%80%93_the_EU-OECD_functional_urban_area_definition.
OECD (2013) Definition of functional urban areas (FUA) for the OECD metropolitan database.
The Economist (2018) The growth of lithium-ion battery power. https://www.economist.com/blogs/graphicdetail/2017/08/daily-chart-8. Accessed 21 June 2018.
Statista, Account P, Account C (2018) Average construction costs to design and build a warehouse/logistic center worldwide. https://www.statista.com/statistics/729151/average-construction-costs-warehouse-and-logistic-centers-worldwide-by-key-city. Accessed 12 Sept 2018.
Coombs C (2018) Amazon to spend $ 200M for one of its most expensive fulfillment centers ever. bizjournals.com. https://www.bizjournals.com/seattle/news/2017/06/09/amazon-to-spend-200m-on-fulfillment-center-for-130.html. Accessed 12 Sep 2018.
Quora (2018) How much would it cost to buy one of everything on Amazon ? https://qz.com/609873/how-much-would-it-cost-to-buy-one-of-everything-on-amazon/. Accessed 13 Sept 2018.
Musolino, G., Rindone, C., Polimeni, A., & Vitetta, A. (2018). Planning urban distribution center location with variable restocking demand scenarios : General methodology and testing in a medium-size town. Transport Policy, 0–1. https://doi.org/10.1016/j.tranpol.2018.04.006.
Acknowledgements
The authors would like to thank Dr. Filipe Batista e Silva for his help and input on the LUISA modelling platform. The views expressed here are purely those of the authors and may not, under any circumstances, be regarded as an official position of the European Commission.
Funding
Not applicable.
Author information
Authors and Affiliations
Contributions
JPA developed the model and ran all computations and analyses. KG ad BF participated in the design of the approach, literature review and interpretation of the results. All authors read and approved the final manuscript.
Corresponding author
Ethics declarations
Competing interests
The authors declare that they have no competing interests.
Additional information
Publisher’s Note
Springer Nature remains neutral with regard to jurisdictional claims in published maps and institutional affiliations.
Rights and permissions
Open Access This article is distributed under the terms of the Creative Commons Attribution 4.0 International License (http://creativecommons.org/licenses/by/4.0/), which permits unrestricted use, distribution, and reproduction in any medium, provided you give appropriate credit to the original author(s) and the source, provide a link to the Creative Commons license, and indicate if changes were made.
About this article

Cite this article
Aurambout, JP., Gkoumas, K. & Ciuffo, B. Last mile delivery by drones: an estimation of viable market potential and access to citizens across European cities. Eur. Transp. Res. Rev. 11, 30 (2019). https://doi.org/10.1186/s12544-019-0368-2
Received:
Accepted:
Published:
DOI: https://doi.org/10.1186/s12544-019-0368-2