- Original Paper
- Open access
- Published:
Assessing the economic and environmental impacts of urban food systems for public school canteens: case study of Great Lyon region
European Transport Research Review volume 10, Article number: 37 (2018)
Abstract
Purpose
Urban logistics is a subject that interests both city planners and researchers. Although many works are found in non-food distribution, food-based logistics is less studied in an urban context, and sustainability issues of urban food systems remain little analysed, but it is a crucial element for local public authorities. This paper proposes a methodology for assessing scenarios of advanced urban food logistics; more precisely to answer the question of how school canteen distribution scenarios can be assessed in an economic and environmental viewpoint.
Methods
To deal with those issues, the paper proposes to develop a scenario assessment framework combining a demand estimation model, a transport supply estimation method and a set of evaluation indicators (for both economic and environmental impacts). The demand estimation model generates first a number of meals per canteen then transforms it into a food quantity, based on carrier’s information and other practice’s feedbacks; the transport estimation is made with a combination of route construction algorithms that reproduce the logic of current Transportation Management System (TMS). The economic evaluation is made via direct operational costs estimation (both fixed and variable) and the environmental evaluation using COPERT V for direct emission’s assessment.
Results
Three scenarios are assessed: the current situation with the operational warehouse, the use of an alternative platform in another location and the combination of both. To address the application issues, the proposed framework is compared to the use of disconnected commercial tools on the three scenarios. We observe that the first two scenarios are close in terms of travelled distances, times and costs. The third scenario, which involves two platforms, results on higher distances and times, and consequently on higher costs and higher for some of the environmental emissions. That scenario does not allow, with the considered demand, economies of scale (i.e. using less vehicles or in a more consolidated way). When comparing the two assessment methods, the proposed framework results on slightly higher travelled distances and times, but the same number of vehicles. However, results can be considered equivalent since the gap between the two assessment methods is in general around 5% for most indicators.
Conclusion
It can be observed that the location of the platform is a key element, not only related to travelled distances, but also to the infrastructures used and their accessibility to the delivery destinations. However, this first assessment shows the interests and opportunities of food city supply solutions and merits further developments. The proposed framework allows to assess food distribution scenarios representing current practices, and would be extended to represent different alternatives of food distribution. Urban logistics is a subject that interests both city planners and researchers. Although many works are found in non-food distribution, food-based logistics is less studied in an urban context, and sustainability issues of urban food systems remain little analysed, but are a crucial element for local public authorities. This paper proposes a methodology for assessing scenarios of advanced urban food logistics; more precisely to answer the question of how urban food logistics supply.
1 Introduction
Food supply arises numerous challenges in terms of sustainability, such as environmental impacts, social equity and economic development. There are different policy discussions at local and global scales in terms of food supply and distribution, mainly in urban context that involves the coordination of multiple producers, distributors, logistics operators and traders of foods. When the availability of food is ensured, the food supply is made with high economic, social and environmental costs [1]. In order to decrease the transport nuisances and to improve the quality and sustainability of the food supply systems, several cities have started to think on how to outperform their local supply systems by combining proximity producers’ supply with advanced city logistics systems.
To deal with the urban food security issues, several local authorities and supply chain stakeholders have developed different policies and actions, most of them related to food production (agriculture), consumption or availability [2, 3]. They propose the local development of food hubs concept as an efficient solution. Severson and Schmit [2] study how to build a food hub successfully through the cooperative experience in the state of New York. They focus on six key challengesFootnote 1 in food supply chain that are receiving renewed attention and support (from public and private stakeholders) as a hopeful tool through which producers access various supply chains. Stroink and Nelson [3] study the complexity of the regional local food system in Northern Ontario, USA. This research concludes that food hubs promote strong linkages between food and health by establishing operations within local communities.
In city/urban logistics, many transport policies have been deployed, most of them dealing with parcel and pallet transport (for non-perishable goods) made by third parties. Taniguchi et al. [4] promote network modelling and intelligent transport system as an analysis tool. Macharis and Melo [5] propose multiple perspectives to study city distribution and urban freight transport. Delaître and De Barbeyrac [6] study the development and improvement of an Urban Distribution Centre as an urban logistics solution. Durand and Gonzalez-Feliu [7] analyse if there are proximity delivery services in the city impact on shopping trips. Finally [8] take into account the sustainability impacts on urban logistics and aims to provide a conceptual framework for urban logistics planning as well as a basis for deploying sustainability city solutions to reduce those impacts.
Nevertheless, food distribution remains a little studied subject also in city logistics, [9,10,11]. Cretella and Buenger [9] investigate the evolving importance of food and urban agriculture in Rotterdam and how social and economic political objectives are elaborated around food. This municipality promotes citizens investment in green roofs, insulation of houses, purchase of local products, and sustainable choice making as consumers. Morganti and Gonzalez-Feliu [10] and Tozzi et al. [11] study the city logistics for perishable products in Parma, Italy. They analyse the case of the Parma’s Food Hub and focus on the impacts for Parma city of the urban goods movements.
One of the main questions when examining an urban food system and its future deployment is its sustainability. More precisely, an efficient delivery system for the school canteens is key to ensure the distribution of food in an efficient way both time and quality wise [2]. However, the economic efficiency is not the only question to address. Indeed, aiming to deploy sustainable food systems, local authorities need to consider not only food quality and security issues, but also prevent the environmental impacts that are generated by the food supply and transport systems. Canteen supply and distribution is then a good way to “make the example” and propose a food system that takes into account all those components.
In particular, an increasing number of municipalities are interested on introducing organic and local products on the students’ meals menu as a measure to improve its nutritional and health quality for the children and to reduce the environmental impacts [12,13,14]. That strategy results on making the transformation (cooking) at neighbourhood platforms where nowadays the main activities are related to mixing and heating those semi-manufactured products. In this way, they ensure a market and encourage to structure local (and sometimes organic) food production and system supply chains, thus supporting local value creation and employment. Compared to conventional channels, local and organic food supply chain may produce more expensive food products. Therefore, there is a strong challenge to optimize the logistics and supply chain costs to maintain an affordable meal cost. This makes necessary to reduce the distance that food travels to reach the school canteen, becoming an easier access to freshest and better quality foods. Thus, school canteen distribution takes a particular interest for local authorities, but, is often operationally managed by logistics providers.
However the scientific literature, transport is often considered an adjustment variable and not assessed globally. To develop such transport systems and include them on a global urban food policy, it is important to provide relevant decision support tools. Although such tools start to be used for non-food transport, they need to be adapted to the specificity (in demand characterization, distribution schemes, etc.) to the field of food distribution, and more precisely to that of canteen distribution, for which very few works have been done and remain preliminary.
For that reason, this paper proposes a framework to simulate various delivery scenarios, based on the localization of food hubs and capacity of the trucks that are used. The economic and environmental impacts of these scenarios are then assessed. We applied the proposed methodology to the assessment of possible Food hub-based distribution systems using public data from the Great Lyon region. Several scenarios of distribution are thus proposed and assessed within the middle school canteens in the entire urban area.
The paper is organized as follows. First, the background of this research is presented. Second, the scenario assessment methodology is presented. In addition, the scenarios to assess are described, as well as the data available on the proposed case. Then, the results of this assessment are provided. Finally, the conclusions and the perspectives are showed.
2 Background
Food security is currently one of the main topics that involve public and private stakeholders with the common goal of helping the World’s population [15, 16]. Moreover, since World’s urban population is increasing, the analysis of sustainable and equitable urban food system has been identified as a priority [17, 18]. In the literature, many works about urban food systems can be found (a Scopus-based lexical search showed more than 300 resultsFootnote 2).
The main subjects of those works include agriculture, food policy, food planning [19] and food security, but only a small set of works deal explicitly with food transport and distribution to or within cities. Even when regarding the literature on city/urban logistics only few works deal with food supply and distribution (as shown in the three most recent reference books in city/urban logistics [4, 5, 8]). Most of those works deal with non-food distribution to retailers and/or consumers. Some of them include food and non-food flows (both). Nevertheless, works addressing explicitly food distribution remain a small minority.
Nevertheless, some of those works are relevant and can be considered pioneers on the field. The first work found in the literature review dates from the 70’s [20]; authors establish a public oversight of the local food supply and distribution function, and formalize the main issues of supplying cities with food. Likewise, [21] explains the importance of urban food planning and its influence on food logistics and sustainability, [10, 22] study the perishable products distribution by proposing the Food hub concept as a consolidation solution to avoid negatives impacts on the food sustainability by decreasing the food miles. In [21], they present a case study in Parma, Italy where the food hub concept is successfully implemented. The authors define also the notion of last food mile [22], to take into account the specificity of food distribution in city logistics.
One of the most important findings in urban food distribution is the relationship between the urban food transportation and sustainability, [23, 24] enhance the impact of sustainable urban food strategy. They propose six goals of the Sustainable Food Cities: (1) promoting healthy and sustainable food to the public; (2) tackling food poverty, diet-related ill-health and access to affordable healthy food; (3) building community food knowledge, skills, resources and projects; (4) promoting a vibrant and diverse sustainable food economy; (5) transforming catering and food procurement; and (6) reducing waste and the ecological footprint of the food system.
However, all those works remain either conceptual or mainly qualitative (quantification ones are only descriptive or based on specific surveys and measurements). We find anyway a few works [25,26,27] dealing with quantitative food flow assessment and performing an analysis in catering sector.
Zhang and Sheng [25] study the catering logistic transportation to reduce the transportation cost. They built a transportation path model to acquire the optimal path by using N shortest paths algorithm. Eriksson et al. [26] seek to quantify food waste in institutional catering in Sweden. They estimated the mass of wasted and served food during 3 months and within 30 public kitchens. They found that the satellite kitchens have a higher food waste quantity than the other kitchens that cook and serve the food by their selves. Waste reduction strategies were proposed. Gebresenbet et al. [27] evaluated the performance of an integrated food distribution network in a Sweden catering industry by using Geographic Information System (GIS) tools and location analysis techniques.
Nevertheless, [25] is mainly related to supply chain optimization and [27] proposes vehicle routing and location optimization in a computational way (so for theoretical and conceptual). Another characteristic of those works is that food demand is not quantified via a model or empirical procedure, but random-based generations are proposed to illustrate the optimization methods.
Moreover, the need of suitable decision support methods for public and private planning in terms of urban distribution has led to the development of decision support systems, some of them being operational nowadays [28], like the CLASS platform [29] (for urban consolidation and retailing land-use issues), PLUME software [30] (for parcel delivery platform location), and some transport flow generation software tools [31, 32], mainly based on demand models. However, those systems are related to non-food distribution. Indeed, although some of them propose food and non-food distribution flows, they are developed and calibrated based on classical parcel and pallet distribution schemes, related to non-perishable non-fragile goods. Anyway, local authorities, being conscious of the need of having sustainable urban food systems and that those systems’ sustainability passes also through the development of sustainable food transport systems (i.e., food distribution needs also to be considered, adding it to the already studied, such as agriculture, food consumption and food policy, among others). In recent years, one of the main problems is institutional catering, mainly related to school canteens [33].
Recently it has been shown that a “unique” model able to represent any situation is not suitable for urban logistics since each city has particularities that need to be taken into account and then modelled [34]. However, as already done in personal transport, a general methodology can be defined to assess those distribution systems in a comparable way in the different context.
Thus, we propose a methodology to simulate and assess the economic and environmental impacts of scenarios of food supply systems. It was developed for canteen distribution. However, the proposed procedures may be adapted (mainly through their parameters and assumptions) to other institutional catering, and potentially other food distribution schemes, if data inputs are available to adapt the models to the spatial and functional cases (i.e. city and distribution scheme) That methodology is presented as follows and will be tested on a scenario simulation for the urban area of Lyon (France) on the basis of realistic scenarios.
3 Methodology
The goal of the paper is to assess the economic and environmental impacts of different food distribution scenarios and consequently to support decision making in urban food logistics strategic and tactical planning. To deal with that issue, each scenario is then assessed using economic and environmental indicators. The proposed framework needs to be applicable to different contexts using standard data, in order to ensure transferability. For that reason, we propose a modular framework for assessing food-based distribution scenario that can further be adapted to different applications, but also tools that are available. Therefore, the framework will combine the different modules in an integrated way, using standard or unified models to estimate the different elements needed to assess the scenarios, but in a coordinated procedure.
Moreover, the proposed framework introduces a set of hypotheses, representation patterns and primary data (mainly for economic and environmental assessment) to simulate then assess scenarios of urban food distribution. The modular structure and the use of standard and transferable models allow to generate easily several potential scenarios and to compare each scenario with others according to economic and environmental indicators. Figure 1 depicts the proposed framework with the different steps to produce new food distribution scenario.

Chart of the proposed methodology
In a general sustainability assessment framework, indicators should address economic, environmental and social impacts. Nonetheless, and as shown by recent works in literature [5, 35, 36], most social indicators are qualitative and/or obtained from satisfaction or acceptability surveys. Those indicators are still discussed at an initial stage, and their quantification arises numerous questions, which are still unanswered. For those reasons, the social impact estimation is not considered in the present work.
3.1 The scenario construction phase
The scenario construction phase is composed of three stages. The first stage consists in gathering and completing data necessary to build the different scenarios to assess. In the second stage, the food demand to be delivered as well as the main spatial and temporal constraints are estimated via a demand estimation model. Finally, the third step is to estimate the transport flows given the estimated demand and the food delivery system’s characteristics and service settings, via a supply estimation procedure.
Although many works address urban logistics assessment and evaluation, and propose a plethora of indicators [35, 37,38,39], most of them have a common point: they can be calculated from the estimation of total travelled distances and times. The economic aspects can be evaluated by defining the costs and benefits of the urban logistics system and assessing the system’s viability. The environmental assessment can be carried out to identify the main impacts of the system on the environment and estimate them. Regarding social evaluation and assessment, it is still difficult to produce quantitative consensual evaluations, although congestion, employment and satisfaction seem the easiest indicators to quantify. A serious social assessment would require a more qualitative approach, with interviews with the main interested parties (for example employees, inhabitants of the city, customers of the food service). Consequently, this paper will focus only on economic and environmental evaluation and assessment.
To build the scenario assessment, we will compare different alternatives to the current logistics scheme in the direction of increasing the part of small local producers. Those scenarios will be defined further, but they will be organized in three main groups:
-
Reference situation: The system as it is nowadays and the logical evolution (business as usual).
-
The inclusion of an urban consolidation centre (UCC), but without changing the current producers and suppliers.
-
The combination of this UCC with new forms of food collection and distribution systems from small producers, in food hub logic.
We consider two distinct levels of assessment: (i) economic assessment, (ii) environmental assessment. The methodology aims to compare two scenarios in a transferability perspective; it is important that data used follows a set of standards or at least unified patterns in order to ensure the coherence of the different methods. Indeed, since while assessing scenarios we are representing a reality, the choice here is that of a representation that is able to be made to any scenario in any city in France, and then a representation using standard models and tools, which errors and bias are known and easy to interpret and take into account in the analysis phases. It is important to note that since a model is a representation of the reality seen by the modeller, the different errors and bias are related to different elements:
-
The data collection errors and bias related to data used for modelling;
-
The errors and bias of input data (when using the model);
-
The interpretation of the reality by the modeller;
-
The hypotheses and assumptions made when developing the model (economic and environmental coefficient, for example);
-
Other errors and bias related to data processing and analysis (related to aggregation; data lacks, etc.).
In this context, the validity and relevance of a model is not only related to the robustness of the calibration method or to the statistics characteristics of the data used, but also to the aim and scope of the model, the uses that will be expected (and the degree of specialization of the potential users) and the needs of accuracy related to those uses. Therefore, the choice of the data that is used and the adaptation of data aggregation and is motivated by the use that is envisioned for the models [40].
Since we aim to propose a transferable methodology able to be used to any French city, it is important that the different modules of the proposed framework use standard databases able to be produced for any city of France. Moreover, the results of the assessment should be presented in a visual way, so a spatial approach is necessary. To deal with those needs, geographic and demographic data is needed. Since January 2017, different national and standard data sources are available at the open data website of the French government.Footnote 3 We use mainly the economic activity registry (SIRENE file) and the open address database to geo-localize them. For spatial processing of data (and the calculation of distances and travel times), the most suitable is to use data from existing mapping platforms: Google Maps, Bing, Open Street Maps, etc. In the proposed framework, we used mainly Open Street Maps, to follow an open data policy.
To characterize demand, but also transport supply, data from carrier organization is necessary. It has been obtained from the carriers that will be considered in the scenario assessment, by a combination of quantitative and qualitative data collected from those carriers. To that issue, several semi-directive interviews to shippers, receivers and transport carriers of the considered food distribution system were carried out between September 2016 and May 2017. The information of how carriers are organized will be completed by assumptions to define the different scenarios to assess. Currently, a scenario is defined by a food distribution system, composed by various elements (analogously to other distribution systems, [41] as for example):
-
Its network structure: a distribution system can be single echelon (i.e. delivering directly the canteens from the food stocking facilities) or multi-echelon (i.e. using different facilities, like central kitchens, satellite warehouses, cross-docking points, etc.)
-
Its vehicle fleet to deliver customers. Those fleets can be homogeneous (i.e. all vehicles have the same characteristics) or heterogeneous (different types of vehicles are used). Those vehicles have specific characteristics, mainly their capacity, EURO norms and use conditions, among others, which influence the elementary environmental impacts and economic costs.
-
The employment organization related to the system, i.e. number of employees and specialty/generality of the works.
-
The scheduling/work time constraints, the service quality settings and other organizational elements to take into account.
For each scenario, it is needed to define a demand to deliver, the characteristics of the urban food distribution system to deliver that demand, then to assess the impacts by estimating the travelled distances and times and the use of the resources to deliver the demand. The demand quantities will be estimated via a demand generation model, which will be built from carriers’ information considering the main assumptions and choices to represent the reality of the field. The supply characteristics (i.e. service settings and resources) are assumptions related to the scenario, but can be obtained from real situations then built by extrapolation or addition of new assumptions. To estimate the delivery routes, a supply estimation procedure is used, based on a transport planning quantitative method. That procedure is a reproduction of the main transport management systems used in practice, but allows a flexibility of use to adapt it to the scenarios we aim to assess.
The second stage is that of demand estimation. The demand estimation can be carried out following different approaches. If current demand is known (or temporal series are available), future demand can be estimated by direct forecasting methods from existing data, mainly issued from inference or time series statistics [40]. If this is not the case, a demand estimation model is needed, or an empirical estimation can be done when no other possibility is available [40]. Although works on urban food supply are various, only few of them are aimed at estimating or forecasting urban food demand [42], all for the Ho.Re.Ca. sector and following the same principle of general modelling frameworks, which refer in urban goods transport to those of [32]. That approach, which defines demand models starting by freight generation or freight trip generation via functional form-based category classification logic. Each category corresponds then to an activity sector or a land use sector [43]. However, that approach separates freight quantities from freight trips.
In our case, we propose a mixed approach to deploy this model, i.e. a modelling approach for food distribution that combines quantitative and qualitative data, in order to understand the generation logic of urban food systems and therefore proposes a framework able to be applied to different food distribution schemes. Since those schemes are different and we need (to characterize those schemes individually) to have knowledge of the supply chains studied, we propose a general framework, which then will be applied to calibrate models for each food distribution system.
In order to propose a generalizable model, we propose an inductive approach. First, given a sector (institutional catering and more precisely school canteens) a set of interviews on different key stakeholders of school canteen distribution have been selected and interviewed:
-
Four representative of public authorities (municipalities),
-
Three stakeholders of school canteen logistics
-
Two experts on urban food distribution mainly related to canteens.
Semi-structured interviews have been deployed to qualitatively characterize the school canteen supply chain in the urban area, and the related stakeholders have also been asked key figures. Moreover, secondary data on five French cities of different sizes and organizations has also been used. That data are from different nature and different time horizons, and are not food- specific urban goods, but contain various key figures for the Ho.Re.Ca sector and for the institutional catering’ logistics. From the combination of quantitative and qualitative data, we can build a model in a way to make that model construction procedure transferable to other food distribution systems. To do that, the construction of the model needs to take into account the data needed in order not to be too specific and have a generalizable canvas. From the interviews, but also from key figures of the carriers interviewed, it appears that both freight commodities and freight trips are related.
Indeed, institutional catering is in France mainly prepared in central kitchens that then deliver school canteen (which make some small tasks as heating, cutting and preparing fresh vegetables and fruits, etc). Those canteens are delivered daily by the central kitchen (so each school canteen needs at least one delivery per day independently of the quantity delivered). At the central kitchen, the demand quantities for each school canteen are converted in needs of prepared food, which allows to estimate the quantities of raw products needed (which delivery frequencies and other characteristics are related to the organization of each central kitchen). To generalize that, we can state that for each canteen, the demand can be counted in number of meals, which is related to the number of potential customers, in the following way:
Where \( {N}_{meals}^s \) is the number of meals per day at school s (for tactical planning, an average daily number of meals is a suitable indicator), \( {N}_{students}^s \) the number of students registered at school s and K a coefficient estimated by yearly statistics of a set of homogeneous school canteen. In the considered case (school canteens), the interviews showed that the coefficient K is strongly related to the social local context, but is very stable within each urban area. For example, the daily average percentage of students that eat at the school canteen for each middle school in Paris and Lyon is similar, but it is double than that of other cities, such as Saint-Etienne. We also observe that Paris and Lyon have higher similarities in consumption and menu composition than Saint-Etienne or Montpellier, for example. From those considerations, we set the value of K from the daily average percentage of students that eat at school canteen, calculated for the entire urban zone of the scenarios to assess.
After defining the daily number of meals \( {N}_{meals}^s \) of each school canteen, and taking into account the food logistic system (which will be described in next section when presenting an example of application), we need to define the quantities to deliver. To do this, once the number of meals is known, the quantities of food necessary to provide meals to each school canteen can be estimated by converting the total number of meals managed by the central kitchen per day into average weights of food to compose the meals. The interviews showed that one central kitchen establishes the same menu for all canteens assigned to it. Moreover, in order to make a suitable estimation, we estimate the quantities of food needed and then we forecast an average daily quantity. More precisely, the proposed estimation procedure works as follows.
-
1.
Estimation of the food portion (weight per meal). First, we classify the school canteen type (Primary, Middle or High School). Itis represented by the amount of food consumed (in g/meal) according to the age of the students and the nutritional requirements established by the national government. Then, the average composition per meal \( {G}_{meal}^c \) is estimated, where c is the category of school (p: primary school; m: middle school; h: high school).
-
2.
Calculation of the daily demand of the central kitchen, from the overall needs of cooked food and conversion tables (to take into account the eventual losses related to the cooking processes and/or food waste at canteens). The loss coefficient α (which allows to consider the food loses) has been established via primary and secondary data on an average basis, without entering in detail on the management of canteens and the type of cooking preparation and distribution (hot or cold distribution).
The yearly quantity of food required by central kitchen is estimated with the following relation:
Once we know the total quantities needed by the central kitchen, we estimate the percentage of fresh fruits and vegetables \( {Q}_{fresh}^c \), estimated as follows: \( {Q}_{fresh}^c={Q}_{kitchen}^c.{K}^{fresh} \), where Kfresh is established in the national legislation of school canteens, and adjusted by local authorities. Note that to estimate the daily quantities to deliver each school canteen, the relation remains similar:
That modelling framework needs to be calibrated for each urban area (since the specificity of the food distribution systems, but also those of scenarios to assess, will differ at each use). However, this is similar to what occurs to four-step models [44] used in personal urban transport and in several freight demand generation applications [45].
The last stage of the first phase is the construction of delivery routes for food supply. In literature, three categories of methods can be observed; empirical procedures [46, 47]; analytic models [48, 49] and route construction procedures [50, 51]. The first two methods are quicker to implement and require fewer resources, but do not allow routes to be spatialized. Moreover, there is a practical reason of deploying route construction methods since many Transport Management Systems (TMS) are based on those methods [52]. Moreover, when aiming to take into account real traffic conditions and plot the routes on a city map route construction procedures based on algorithms are required. Those route construction procedures in urban logistics relate mainly to vehicle routing problem (VRP) algorithms [38]. The aim of the proposed methodology is to reproduce realistic routes, so the use of VRP algorithms does not aim to find best solutions or theoretical optima but to reproduce the use of commercial transport planning and optimization tools.
In other words, a VRP algorithm that gives results close to those of current TMS seems to be a suitable tool if the resulting routes have the travel distances and times within the dispersion distribution of a representative set of urban delivery routes [50,51,52,53,54]. For that reason, a set of algorithms that reproduce the calculation algorithms of TMS have been built. To do this, we use the VRPH is an open-source library written in C++ [55], which contains various elementary moves that can be combined to construct algorithms.
The proposed set of algorithms contains two route construction algorithms (a Clarke and Wright [56] savings algorithm and a cluster-first route-second algorithm based on a nearest neighbour procedure [57]), then two post-optimization algorithms (a simulated annealing and a record-to-record algorithm based on Tabu Search). Those algorithms are considered standard [57, 58] and have been used in many TMS [52]. Moreover, the VRPH library allows to make the algorithm adaptable to different variants of VRP and then to represent different constraints and characteristics of real transport systems [55]. In the present work, we used a time optimization since it is the most suitable in urban logistics according to practical issues [51]. The particularity of the proposed approach is that the route construction procedure is interfaced to the data production modules in order to ensure the correct transferability from one context to another. Therefore, it was necessary to estimate a suitable path between two points to convert the real network into a VRP graph. To do that, the shortest path (in terms of travel time) from two points is pre-calculated using a Dijkstra’s algorithm [59], using OpenStreetMap to estimate the possible paths between two points. Finally, the obtained results in terms of travelled distances and times are extracted and used as input data for the estimation of impacts (see next subsection).
The optimization problem solved with the VRP algorithm will vary in relation to the constraints and characteristics of the food transport system to assess. For the proposed application field (school canteens), the route construction method was configured according to the following requirements:
-
A fleet of vehicles serves a set of delivery points;
-
The demand of each customer per visit must be satisfied by a vehicle assigned on the route;
-
Each vehicle leaves and returns to the depot;
-
The vehicle capacity should not be exceeded;
-
The delivery stages are single stages and;
-
The working time constraints for the driver and vehicle on each route should not be violated.
-
The vehicle must respect the road directions (direction of traffic, type of road, ...)
3.2 Scenario assessment
The scenario construction phase aims to define the scenario settings and estimate the corresponding demand and supply, resulting into a set of data including travelled distances and number of vehicles. However, to assess the economic and environmental impacts of the scenarios, that data need to be completed. Indeed, social evaluation remains preliminary and works are mainly qualitative [35, 36], so we will focus here on economic and environmental indicators (presenting some of them in the results) and propose how to assess some social indicators in further developments. Anyway, before defining indicators, the resulting travelled distances are also converted into travel times (using the average distances calculated via cartographic data), since those times are necessary to the estimation of different indicators.
3.2.1 Economic impact estimation
The economic evaluation is based on a cost analysis. Indeed, three approaches are mainly used: cost analyses, analyses of margins on variable costs and cost benefit analyses. All three methods need the identification of costs, which can be calculated on the same basis. For that reason, we propose to start by an only cost analysis (since the scenarios assessed are related to the system service settings and no hypothesis on fees and funding strategies is for the moment considered). Anyway, by estimating costs in a unified way, the framework would be further completed to allow other assessments needing to consider benefits.
When defining costs related to urban food distribution, there are two main approaches to classify costs:
-
The first, mainly used in long-term planning issues (mainly related to cost-benefit analysis in a multi-year horizon), sees costs as being related to investment (to be paid before use and that need to be refunded in a multi-year period) and operational (to be paid operationally at each use of the system and having to be covered by monetary benefits each year);
-
The second, used when making cost only analyses or for operational assessments (mainly for a given use period that is a day, a week or a year), is to consider costs related to the use of vehicles: fixed costs are those not related to the travelled distances nor working times, and variable costs are those related to them.
In the present work, the second approach is adopted. Fixed costs are not related to vehicle use, so they are defined by a fixed quantity for the given used period. Variable costs can depend on travel distances, on travel times, but also on the quantities to manage (mainly for central kitchen or inventory facilities). We can then formalize the calculation of total daily costs of a scenario a, noted, Ca as follows:
Where Cfixed are the fixed costs, UCd the unitary costs depending on travelled distances; UCt the unitary costs depending on working time (not only travel time, but also time passed for loading and unloading, breaks and other needs of drivers during their working times) and UCw the unitary costs (depending on a quantity of freight) related to kitchen and warehousing activities. Moreover, da, ta and dema are respectively the total travelled distances, the total working times and the total demand assessed for scenario a.
Those costs result from the total travelled distances and times, as well as the choices in terms of vehicles and service settings, i.e.
-
I.
The total number of vehicles used
-
II.
The total distance (km)
-
III.
The total time spend (hours)
-
IV.
The total quantity of food distributed (kg)
To estimate those costs, we started from the definition of the main macro-categories of costs, adapting the works of [34, 40] to food distribution. Then, and via the results of the semi-structured interviews, we completed those costs by identifying more precisely the assumptions and variables to take into account. After that, a first set of costs was established with secondary data (mainly issued from [60], and a second round of interviews (more directive) was established to complete and update them in order to represent the main current practices [61] (Table 1).
In the present work, we consider fixed costs as those associated to drivers (since the number of working hours will be the same for each driver, independently of the driving hours) and to the vehicles (i.e., the number of vehicles, different for each scenario, will give us the vehicle fixed costs). Variable are those associated specifically to vehicle use, mainly to travelled distances (fuel consumption).
3.2.2 Environmental impact estimation
For evaluating the environmental performance of the system, only exhaust direct emissions from the use of vehicles were taken into account. François et al. [62] identified nine environmental indicators for the urban transport sector. However, and as shown in [35, 61, 63], the different stakeholders involved in urban logistics consider mainly global warming and particulate matters. Therefore, we will focus on the following indicators since there are the most relevant for the urban goods transportation sector, according to work cited above:
-
Global warming potential estimated in CO2-equivalent emissions and directly linked with fuel consumption (FC).
-
Particulate matter emissions at exhaust (PM), focusing mainly in PM10.
-
NOx emissions (NOx).
-
Volatile Organic Compounds (VOC) that contribute to photochemical oxidant emissions.
To estimate those emissions, we need first to define the vehicles used. As shown by the interviews responses, main vehicles for canteen distribution are Light Commercial Vehicles (3.5 t), and Heavy-Duty Trucks (14 t). However, a database including trucks from 3.5 to 44 tons (in five categories) has been built. To each category, the emission functions (which relate each of the considered emissions per kilometre and average speeds) are defined:
With i ∈ {CO2, FC, NOx, VOC, PM}
The emission factors and vehicle kilometres are in most cases split into certain classes of road types (as the use of the average speed for its calculation implies) and vehicle categories. The function \( {f}_{emission}^i \) is extracted from the emission database of COPERT V (Computer Programme to calculate Emissions from Road Transport - Methodology and emission factors) [64]. The database used for function definition is from 2017 and includes the different euro norms (from 3 to 5). For the considered application, we concentrate on Light Commercial Vehicles (3.5 t) of Euro 4–98/69/EC norm and Heavy-Duty Trucks (14 t) of HD Euro V – EGR. As the trucks make their rounds quasi continuously during the day (with only small waiting times for the delivery of the packages), the cold emissions were considered negligible. Therefore, the estimated emissions are slightly underestimated.
4 Methodology test and validation
4.1 Validation procedure
To examine the relevance and validity of the proposed methodology, we propose to follow the ideas proposed in [53], to address the representativeness of a modelling and decision support framework with respect to a given reality. According to [53], once a framework is developed and its computational robustness assessed, it is important to refer it to the reality that it aims to represent and see its applicability issues, i.e., if the results are relevant in practice and able to be used to make decisions. To do this, we define first the uses of the proposed framework as well as its aims. Then, we present the conditions of validity and the methods used to examine if those conditions are met.
The proposed framework aims to be used to assess scenarios of urban food distribution systems, assuming they have been deployed and are operational, to compare them (i.e. to make comparative analyses between an initial situation and possible deployment scenarios or to compare two or more scenarios). For that reason, the accuracy of the estimations needs to show if there are differences between the scenarios or not, and represent realistic practices. For those reasons, it is important to avoid over-optimizations or non-realistic practices.
To ensure that, the proposed models (demand and supply) have been developed using techniques which are similar to commercial tools used in practice. Moreover, and to examine the validity of the framework, we propose to assess the scenarios on a realistic case (middle school canteen distribution in Lyon, France) using two different procedures: the first is the proposed framework; the second is to use existing tools sequentially, but not in an integrated way (as on [33]): the demand estimation follows the same mathematical relations in both cases, and the economic and environmental indicators are the same (and then have the same calculation formulas). The only difference is on the supply estimation: the second procedure uses an existing ready-to-use tool, the VRP Spreadsheet Solver, which optimization algorithm is of the same nature and relevance as those of route construction and fleet management software tools [65], and then can be used as a reference for obtaining realistic food transport routes.
4.2 Case study: Food distribution system for the school canteens of the Great Lyon region
As said above, we examine the relevance and application issues of the proposed methodological framework on a food distribution system for school canteens of the Great Lyon region. The stakeholders involved in this food distribution system are the municipality (who establishes the requirements of the meal and the quantity demanded per day), the meal contractor, who transforms the raw food materials into the meals in the central kitchen (facility owned by the municipality) and performs the meal distribution until the school canteens. The aim of the municipality is to substitute some of those producers by local and organic producers of fresh products and make the transformation (cooking) at neighbourhood platforms where nowadays the main activities are related to mixing and heating those semi-manufactured products. In this research, the primary data was collected through semi-structured interviews with the municipality, the meal contractor and the most important raw food material provider.
4.2.1 Geographic and demographic context
The urban area of the Great Lyon groups 30 towns including Lyon with nine districts. We focus our study on 117 middle school canteens that represent almost 25.000 meals per day. Figure 2 shows the layout of the school canteens (pink circles with the number of school canteens into the clustered area). The characteristics of the demanded product are classified according fresh fruits and vegetables and other family products. Currently, the school canteens are supplied mainly on semi-manufactured and frozen products coming from platforms at different locations of the regional area. According to the data analysis process, the current middle school canteens’ supply is made through a central kitchen located in the north area of Great Lyon. This Central kitchen (CC) supplies the 117 school canteens. Those facilities (the two platforms - blue and green circles - as well as the central kitchen-orange circle) are depicted in Fig. 2.

Great Lyon public middle school canteens (Authors’ elaboration using the ANNONA platform and OpenStreet Map as base map)
4.2.2 Analysis of current demand
To analyse the current demand, the demand generation model proposed was applied. Table 2 presents the yearly demand estimation (in kg) and both the number of total students at middle schools and those that are eating daily at canteen. Those results are detailed per district of the main city (Lyon) and the overall results for all other towns of the conurbation are also shown.
The district that has the biggest demand is the 5th District, which is also the most populated in terms of number of students registered with 5.933 students. To estimate the daily demand for the school canteen, according to the primary data information (interviews with the contractor of the meal supply), the canteens are open 145 days per year. Moreover, and following those interviews, the percentage of students eating at the school canteen (K) was set to 40% of the students registered.
4.2.3 Definition of scenario hypotheses
The last step of the scenario construction process is to define some hypotheses to process supply estimation. The type of vehicles used as parameter in the supply estimation are those that are currently used, which are Euro 4 Light Commercial Vehicles bi-temperature of 3.5 and 14 tons with norm euro 5.
For the distribution, we take into account the current distribution situation, the central kitchen supplies the middle school canteens and is itself supplied by the current main food supplier (E), respecting the requirements of organic and local production, this central warehouse is located in the south-west of the Great Lyon area. Two other scenarios were taking into account by replacing E by Corbas Food wholesale market who could accomplish the organic and local products restrictions, demanded by the community, and that is located in the southeast of the Great Lyon area. The food transport system from the distribution platform to middle school canteens with single-stage and multiple vehicles.
-
Scenario 1: The reference situation, the central kitchen is supplied by E warehouse and then the middle school canteens are supplied by the Central kitchen (see Fig. 3).
Fig. 3 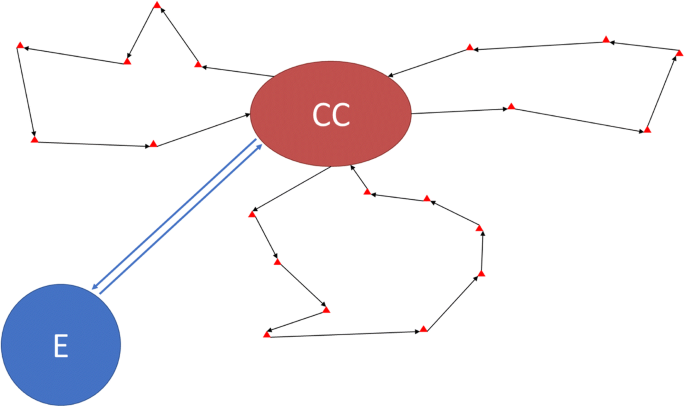
Current food transport system from E warehouse to middle school canteens trough the Central kitchen (CC) with single-stage and multiple vehicles
-
Scenario 2: The central kitchen is supplied by Corbas food wholesaler and then the middle school canteens are supplied by the Central kitchen (see Fig. 4).
Fig. 4 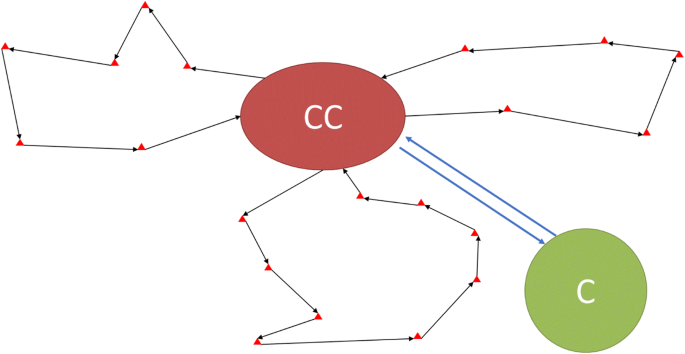
Food transport system from Corbas food wholesaler (C) to middle school canteens trough the Central kitchen (CC) with single-stage and multiple vehicles
-
Scenario 3: The central kitchen is supplied by E (with the five family products except by Fruits and vegetables) and by Corbas (with the Fruits and Vegetables) and then the middle school canteens are supplied by the Central kitchen. For the H3.1 and H3.2, it is necessary to take into account that the daily demand of Fruits and Vegetables is 3000 kg which represents the 22.8% of the total demand and the total daily demand of the other five product families is 10,154 kg which represents the 77.2% of the total demand (see Fig. 5).
Fig. 5 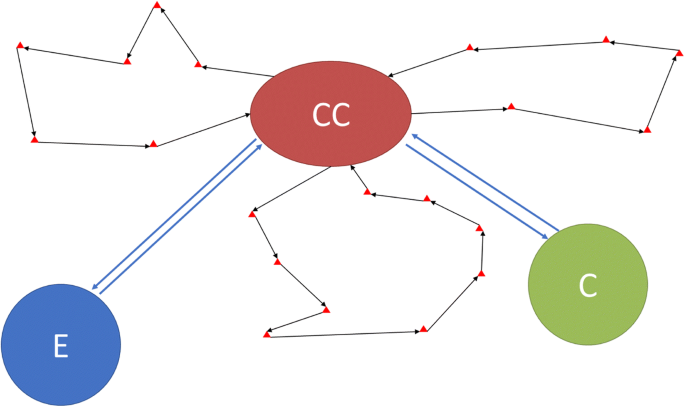
Food transport system from E warehouse and Corbas food wholesaler (C) to middle school canteens trough the Central kitchen (CC) with single-stage and multiple vehicles


5 Results and discussion
The output of scenario construction is a set of information for each scenario about total distance, average speed, and total duration taking into account service time. The scenario assessment of the methodology computes economic and environmental impacts using these outputs.
5.1 Distance and duration analysis
In this section, we present and discuss the main results of the assessment of the three scenarios. First, we estimate the travelled distances and times, issued directly from the route construction procedure (supply estimation model), reported in Table 3.
In the current situation (S1), to supply the 117 canteens, taking into account that the vehicle could make several routes (leaves and return from and to the depot) it is necessary to mobilize one vehicle of 14 t from E warehouse to the central kitchen and eight vehicles from this point to the school canteens respecting the working time. This daily distribution operation takes almost 63 h and 818 km.
In the scenario proposed to replace E by Corbas to supply the 117 canteens (S2), it is necessary to use one vehicle of 14 t from Corbas food wholesaler to the central kitchen and eight vehicles of 3.5 t from this point to the school canteens. This daily distribution operation takes 62 h and almost 793 km. Those results, compared with the scenario 1, have slightly shorter daily operation time (− 0.9%) and less distance travelled (− 3.1%).
In the scenario proposed to conserve the two suppliers, Corbas and E to supply the 117 canteens (S3). The products supplied by Corbas are only fresh fruits and vegetables, which represents the 22.8% of the total daily demand. The rest of the products are supplied by E, which represents the 77.2% of the total daily demand. For this scenario, it is necessary to use one vehicle of 14 t from E warehouse, one other from Corbas food wholesaler to the central kitchen and eight from this point to the school canteens, which makes ten vehicles (two of 14 t and eight of 3,5 t). This daily distribution operation takes almost 64 h and 868 km. Those results compared with the scenario 1, it is necessary to use one more vehicle (14 t), there are more daily operation time (+ 6.1%) and more distance travelled (+ 1.6%). Compared with the scenario 2, there are even more daily operation time (+ 9.5%) and more distance travelled (+ 2.5%).
According to the results calculated with ANNONA, reported in Table 4, in the current situation (S1), it is necessary one vehicle of 14 t from E warehouse to the central kitchen and eight vehicles from this point to the school canteens respecting the working time. This daily distribution operation takes almost 66 h and 762 km.
Regarding the second scenario (S2), it is necessary to use one vehicle of 14 t from Corbas food wholesaler to the central kitchen and eight vehicles of 3.5 t from this point to the school canteens. This daily distribution operation takes 66 h and almost 736 km. Those results compared with the scenario 1, there is less distance travelled (− 3.4%), but the same daily operation time.
Regarding the third scenario (S3), it is necessary to use one vehicle of 14 t from E warehouse, one from Corbas food wholesaler to the central kitchen and eight vehicles of 3.5 t from this point to the school canteens. This daily distribution operation takes 67 h and almost 812 km. Those results compared with the scenario 1, it is necessary use one more vehicle (14 t) there are more daily operation time (+ 1.5%) and more distance travelled (+ 6.6%). On the other hand, these results compared with the scenario 2, there is more daily operation time (+ 1.5%) and more distance travelled (+ 10.3%).
As shown above, the two frameworks estimate a similar transport configuration (same number of vehicles and routes) and then the travelled distances and times can be considered equivalent. Indeed, as the Table 5 shows that gaps between both frameworks remain small and of the same order of magnitude. Indeed, those gaps are between 6.5 to 7.2% in travelled distances in favour of ANNONA, which can be considered being the same in practice and remain stable for all scenarios. In terms of total times, ANNONA results are higher than those of VRPSS, but remain also small (between 5 and 6% in favour of VRP-SS). Those gaps (in total time) are mainly due to travel times (service times remain the same for both methods) and can be imputed to the estimation of average speeds (which is not the same for the two geographic information systems used to retrieve them: ANNONA uses Open Street Maps, and the VRP Spreadsheet Solver uses Bing Maps). However, taken into account the bias introduced by using those two different spatial data production tools, those gaps remain small and stable for all scenarios; consequently results can be considered being similar. Moreover, the ranking of the three different scenarios in terms of distance travelled and total time is the same. Consequently, we can state that the proposed framework estimates realistic routes and can be used to assess suitable scenarios for urban food distribution.
5.2 Economic evaluation
The estimation of the transportation costs is estimated according to the secondary and primary information obtained. The main economic indicators are presented in the Table 6.
The diesel cost was consulted on an official French web site supported by the Ministry of economy and finance, where the French government provides the data of fuel price on France. The vehicle fuel consumption was directly retrieved from the technical data given by the vehicles manufacturer. That information was then discussed and established with the key stakeholders of school canteen distribution during the interviews.
Taking into account that each year the distribution operation is developed in 145 days, the daily transportation cost is estimated and detailed in the Table 7.
The diesel consumption cost for vehicle 3.5 t is 0.26 €/km and for vehicle 14 t is 0.36 €/km.
It is interesting to complement the distance and time evaluation with economic and environmental indicators. In order to compare the three scenarios, Tables 8 and 9 show the results of the economic assessment of the three scenarios.
Taking into account the total daily cost results from the three scenarios using vehicles of 3.5 and 14 t the lower yearly cost is the scenario 2 where Corbas supplies the school canteens through the central kitchen with 427,259 €. It is 1331 € less than the first scenario and 63,941 € less than the third scenario.
Regarding the total daily cost results from the three scenarios using vehicles of 3.5 and 14 t, the lower yearly cost is the scenario 2 where Corbas supplies the school canteens through the central kitchen with 425,127 €. It is 1331 € less than the first scenario and 63,941 € less than the third scenario. This result can be explained by the fact that in the one hand, one vehicle less is necessary than the scenario 3 which represents lower leasing, driver and consumption cost; and in the other hand, less distance travelled which represents lower consumption cost regarding the others two scenarios.
As shown above, the two frameworks estimate a similar economic evaluation. Comparing the results from VRP-SS and VRP-ANNONA, the daily is 15€ and yearly difference is 2132€ among the three scenarios, which means a gap in between of 0.5%.
Finally, even if the differences in time and distance between the two VRP tools could not be taken as negligible, when assessing transport cost, the difference or the gap found is almost null (0.5%). However, in both cases, the relation between travelled distances and total times on one-side and transport costs on the other side were the same (and are linear for both variables, i.e. distances and times). In that context, the estimation of unitary costs is crucial to ensure a representative assessment. In the current application, we estimated unitary costs using carrier information. It should be needed to extend it by proposing a category of vehicles, platforms and drivers in order to be able to adapt the methodology to other contexts.
5.3 Environmental evaluation
The data based extracted is from 2010 regarding the Light Commercial Vehicles (3.5 t) the Euro 4–98/69/EC and for Heavy Duty Trucks (14 t) the HD Euro V – EGR. The environmental evaluation from the VRP results were estimated for each scenario based on the total distance (km) and the average speed of routes in each scenario. The average speed calculated by the VRP Spreadsheet Solver (VRP-SS) using Bing maps and by ANNONA for each scenario is showed in Table 10.
To compare the three scenarios, Tables 11 and 12 show the results of the yearly environmental assessment of the three scenarios.
Taking into account the results of all the environmental indicators, the global warming potential (100 years) that is directly linked with fuel consumption, Particulate matter emissions at exhaust (PM), NOX emissions, Volatile Organic compounds that contribute to Photochemical oxidant emissions, the scenario 2 shows less impacts than the others two scenarios. Comparing these results with Scenario 1, the emission savings are in PM (4%), FC (6%), CO2 (10%), NOX (13%) and for VOC there are not savings. Comparing with scenario 3, the emission savings in CO2 (4%), PM (9%), NOX (20%) and for VOC and FC there are not savings.
The scenario 2 shows fewer impacts than the other two scenarios. Comparing these results with Scenario 1, the emission savings in FC, PM, CO2 and VOC are between 3 and 6%; for NOX is 9%. Comparing with scenario 3, the emission savings in NOX (21%) and PM (8%); nevertheless, FC, CO2 and VOC there are not saving.
Finally, comparing the results of the two tools, there is some differences. The Table 13 the percentage of emission rate calculated by the results from Annona and from SS.
In all the environmental indicators calculated (FC, NOX, VOC and CO2), SS estimate lower emissions than Annona. Those gaps are close for FC, PM and CO2 emissions (0.1 to 5% gap). For VOC, the gap is between 4 and 7%. For NOx, the gap between the two methods is between 11 and 17%.
Environmental impacts are related to both travelled distances and speeds. Since unitary emission factors of COPERT are strongly dependent on speeds, a small speed variation can result on non-negligible gaps at unitary level, so even if distances are close, the use of different speeds has a higher sensitivity in the environmental impact estimation. When proposing deployment scenario assessment, the definition of the most suitable speeds for assessing the scenarios seems to be crucial and needs to be analysed in-depth. Nevertheless, the proposed framework (Annona) remains a valid and coherent tool to make those assessments (most gaps remain homogeneous). It can be used to compare scenarios and then obtain differential results, i.e. gaps between a proposed scenario and a reference.
6 Conclusions and perspectives
This paper proposed a methodology to assess the economic and environmental impacts of city food logistics systems, and applied it to different distribution schemes for the school canteens supply in Lyon (France) to address its application issues. The proposed methodology is divided in two main phases: scenario construction where data are prepared, logistics demand estimated and the resulting delivery routes constructed via a VRP procedure, to estimate travelled distances and total times), and scenario assessment of economic and environmental impacts.
To illustrate it, we assessed three scenarios of school food supply in Lyon’s conurbation, France. The first is a current distribution system, the second proposed a relocation of the central distribution platform, and the third proposed two distribution facilities (one for fresh fruits and vegetables and the second for the other family products). Two types of vehicles were considered. To validate the proposed methodology and address its application issues, the scenarios were assessed with the proposed framework and with a set of existing tools: the proposed framework (ANNONA) is integrated, the second method (SS) needs to combine the methods separately.
Assessment results are similar with both procedures. The ANNONA framework estimated slightly shorter distances but higher times because of the average speed that was taken into account, but differences remain small and when estimating economic impacts we can conclude that the results are equivalents (the gaps between both frameworks are less than 1% for most economical indicators). Concerning the scenario comparison, both models concluded that the two scenarios with one platform present very small gaps, then we can consider as equivalent solutions. In that context, it seems suitable not to change since not all alternative solutions are better than the current one.
The scenario with two platforms is less suitable in terms of transport costs since taken into account current demand, splitting it into two different platforms increases the number of vehicles (i.e. demand is too small to allow economies of scale with this scenario). However, since the interest of the third scenario is to provide fresh fruits and vegetables from one of its main origins, a more global simulation (using the same methodology adapted to a three-echelon system) is required. Moreover, other factors (such as the consideration of local/non-local supply for fruits and vegetables) also need to be considered. This could be done in a further work, as for example modelling short food circuit distribution from independent or grouped producers and defining suitable transport schemes.
This work contributes to the debate on urban food systems and the role of distribution. Preliminary results show that food systems need to consider different variables and settings, and the only food consolidation platforms are not enough to ensure its viability and consequent sustainability. The scenario assessment will be a first step on including non-transport impacts mainly related to energy consumption in the food transformation and distribution chain.
In order to identify a policy, practical implications and proposal of actions for the municipality, the proposed systems imply a consequent modification of supply chain and transport practices. The proposed framework does not only quantify them, but addresses the main application issues via a qualitative analysis and a validation via semi-directive interviews. Indeed, those changes affect different stakeholders in the distribution chain, who have different objectives, issues and perspectives. In that context, the proposed framework needs to be applied in collaboration with the involved stakeholders, in an interactive way, i.e. making the decision makers part of the scenario construction and assessment process in order to improve the scenario construction to deal with their aims and goals. For that reason, a particular focus will be made on how the proposed urban food supply systems impact current practices and which are the risks related to their development.
The proposed framework is dependent on the robustness and accuracy of the different models it uses, as shown in the economic and environmental assessment. Although gaps remain small for distances, times and very small for costs, the sensitivity of the environmental impact assessment models (COPERT) make the estimation of the average speeds an important point to focus on. A further direction of the research would be that of establishing average travel profiles or defining a typology of roads and behaviours to have a higher detail of the different parts of a route (and the resulting speeds for each part).
However, the proposed methodology presents other limits. Nowadays, there are not unified and standard databases to quantify food transport flows (only some general surveys on goods transport are available, but they are based on non-perishable goods transport mainly packaged in parcels and pallets). Moreover, canteen distribution data are issued in France mainly from private companies, which imply confidentiality issues and the need of reconstructing part of those data. For those reasons, it is currently difficult to define very specific demand models (for example by type of product, with a fine disaggregation for food supply frequencies, etc.). That has an impact on the route construction procedure and the representation of the resulting transport supply schemes (which degree of detail is dependent on the demand specifications). Nonetheless, further developments on the demand estimation seem to be possible, for example using time series data issued from local authorities (which are customers of distribution carriers). That data is not nowadays available, but they would be used for research purposes; therefore, further work will explore such possibilities. Consequently, with a more detailed demand model, the route construction procedure would evolve to take into account such specificity.
Concerning the replicability of the proposed framework, it has been applied only to middle-school canteen distribution for the conurbation of Lyon, France. However, interviews with various stakeholders of canteen distribution at a National level have shown that if the framework can be adapted to French cities, the main parameters and assumptions (percentage of students who eat daily at the canteen, service settings of the carrier, menu composition in macro-categories of foods, demand requirements, etc.) need to be defined (mainly via quantitative and qualitative data collection processes) for each case. That data collection remains limited and easy to carry out, but it is not possible nowadays to define a unique canteen distribution scheme for the entire country. Anyway, that remains the case in France, further work would explore the question of replicability in other countries.
Another question is the representativeness and suitability of the proposed indicators. The framework is able to estimate indicators related to travelled distance and total times, so other indicators not considered here can be further taken into account. For those reasons, a further works would analyse the relevance of different sustainability indicators for the different involved stakeholders in urban food distribution including all components mentioned above.
Finally, the proposed scenario assessment was a simple case having only a platform location and demand assignment (when two locations were considered together, i.e. scenario 3). Vehicles where the same in all scenarios in order to compare them homogeneously and state on the representativeness of the methodology with respect to the non-integrate use of commercial tools. However, other scenarios could be studied combining different location choices (re-location of the central kitchen or proposal of two or more kitchens, use of different vehicles to include more environmental friendly technologies, re-location of a part of production on small local producers spread in the urban periphery with the need to define a suitable supply system to avoid a multiplication of direct transport flows from each producer to central kitchen, etc.). Nowadays, the location choices and vehicle engines are in an advanced development phase since the algorithms allow to estimate the use of different platforms (and even kitchens) and the environmental assessment of vehicles includes different vehicle engines, but the economic costs of those vehicles and platforms need to be completed and the resulting databases are under construction. However, for the inclusion of local production a specific research may be carried out furtherly since the different supply schemes from small local producers are not established.
Notes
The six key challenges are: (1) Balancing supply and demand; (2) consistent product quality and food safety standards; (3) aggregating sufficient quantities of product to be sold at competitive prices; (4) changing consumer preferences; (5) accessing infrastructure at reasonable cost and, (6) business stability.
Main keywords used: « urban food systems »; « urban food transport »; « urban food distribution »; « urban food »; « urban food supply »; city food; urban food.
References
CONACCA (2009) Centro de Logística Alimentaria ( CELA ) “ MODELO A .” CONACCA-IP
Severson RM, Schmit TM (2015) Building Success of Food Hubs Through the Cooperative Experience-A Case Study Perspective
Stroink ML, Nelson CH (2013) Complexity and food hubs: five case studies from northern Ontario. Local Environ 18:620–635. https://doi.org/10.1080/13549839.2013.798635
Taniguchi E, Thompson RG, Yamada TR, Van Duin (2001) City logistics: network modelling and intelligent transport system
Macharis C, Melo S (2011) City distribution and urban freight transport: multiple perspectives. https://doi.org/10.4337/9780857932754.00001
Delaître L, De Barbeyrac C (2012) Improving an urban distribution Centre, the French case of Samada Monoprix. Procedia Soc Behav Sci 39:753–769. https://doi.org/10.1016/j.sbspro.2012.03.145
Durand B, Gonzalez-Feliu J (2012) Urban logistics and E-grocery: have proximity delivery services a positive impact on shopping trips? Procedia Soc Behav Sci 39:510–520. https://doi.org/10.1016/j.sbspro.2012.03.126
Gonzalez-Feliu J, Semet F, Routhier JJ-L, Semet F (2014) Sustainable urban logistics: concepts, methods and information systems, IDEAS Work Pap Ser from RePEc. https://doi.org/10.1007/978-3-642-31788-0
Cretella A, Buenger MS (2016) Food as creative city politics in the city of Rotterdam. Cities 51:1–10
Morganti E, Gonzalez-Feliu J (2015) City logistics for perishable products. The case of the Parma’s food hub. Case Stud Transp Policy 3:120–128. https://doi.org/10.1016/j.cstp.2014.08.003
Tozzi M, Corazza MV, Musso A (2014) Urban goods movements in a sensitive context: the case of Parma. Res Transp Bus Manag 11:134–141. https://doi.org/10.1016/j.rtbm.2014.03.003
Lessirard J, Patier C, Perret A, Richard M (2017) Sociétés de restauration collective en gestion concédée, en restauration commerciale et approvisionnements de proximité
Izumi BT, Alaimo K, Hamm MW (2010) Farm-to-school Programs : perspectives of school food service professionals. J Nutr Educ Behav 42:83–91. https://doi.org/10.1016/j.jneb.2008.09.003
Smith J, Andersson G, Gourlay R, Karner S, Egberg B, Sonnino R, Barling D (2016) Balancing competing policy demands : the case of sustainable public sector food procurement. J Clean Prod 112:249–256. https://doi.org/10.1016/j.jclepro.2015.07.065
Erokhin V (2018) Establishing food security and alternatives to international trade in emerging economies. IGI Global, Hershey
Gonzalez-Feliu J, Osorio-Ramírez C, Palacios-Arguello L, Talamantes CA (2018) Local production-based dietary supplement distribution in emerging countries: Bienestarina Distribution in Colombia. In: Establising Food Security and Alternatives to International Trade in Emerging Econmies, pp 297–315
Pisano U, Lepuschitz K, Berger G (2014) Framing Urban Sustainable Development: Features, Challenges and Potentials of urban SD from a multi-level governance perspective. ESDN Quarterly Report, (31), 30.
Heilig GK (2012) World urbanization prospects the 2011 revision. United Nations, Department of Economic and Social Affairs (DESA), Population Divivision, Population Estimates and Projections Section, New York
Nichols K (2006) Alternative urban futures: planning for sustainable development in cities throughout the world. Ecol Econ 59:182–183. https://doi.org/10.1016/j.ecolecon.2005.09.026
Blakey RC, Cole EH, Haygood K, Hebert SL, King PB, McGrane MT, Trombly JW, Williams MI, Luce FD, Wilson RL (1977) Food Distribution and Consumption in Knoxville: Exploring Food-related Local Planning Issues
Morganti E (2011) Urban food planning, city logistics and sustainability: the role of the wholesale produce market. The cases of Parma and Bologna food hubs
Morganti E, Gonzalez-Feliu J (2015) The last food mile concept as a city logistics solution for perishable products. Enterprise Interoperability: Interoperability for Agility, Resilience and Plasticity of Collaborations (I-ESA 14 Proceedings), p 202. https://doi.org/10.1002/9781119081418.ch28
Prosperi P, Moragues-Faus A, Sonnino R, aDevereux C (2015) Measuring progress towards sustainable food cities: Sustainability and food security indicators Report of the ESRC financed Project “Enhancing the Impact of Sustainable Urban Food Strategies”. Access: http://sustainablefoodcities.org/getstarted/developingindicators
Goggins G, Rau H (2016) Beyond calorie counting : assessing the sustainability of food provided for public consumption. J Clean Prod 112:257–266. https://doi.org/10.1016/j.jclepro.2015.06.035
Zhang H, Sheng W (2010) Application of Dijkstra-Based N-Shortest-Paths Algorithm to Catering Logistics Transportation. In: ICLEM 2010: Logistics for Sustained Economic Development: Infrastructure, Information, Integration, pp 3317–3323
Eriksson M, Persson Osowski C, Malefors C, Björkman J, Eriksson E (2017) Quantification of food waste in public catering services – a case study from a Swedish municipality. Waste Manag 61:415–422. https://doi.org/10.1016/j.wasman.2017.01.035
Gebresenbet G, Nordmark I, Bosona T, Ljungberg D (2011) Potential for optimised food deliveries in and around Uppsala city, Sweden. J Transp Geogr 19:1456–1464. https://doi.org/10.1016/j.jtrangeo.2011.08.005
Parra Herrera JE, Palacios-Argüello LV, Gonzalez-Feliu J, Adarme-Jaimes W (2016) Decision support system design requirements, information management, and urban logistics efficiency: case study of Bogotá, Colombia. In Handbook of Research on Information Management for Effective Logistics and Supply Chains (pp. 223-238). IGI Global
Comi A, Rosati L (2013) CLASS: a city logistics analysis and simulation support system. Procedia Social Behav Sci 87:321–337
Guyon O, Absi N, Boudouin D, Feillet D (2010) Plates-formes en centre ville pour la Logistique Urbaine: étude sur la ville de Marseille. In: 2ème Journée Recherche “Mobilité, Transport et Logistique” (MTL 2010)
Ambrosini C, Routhier J-L, Sonntag H, Meimbresse B (2008) Urban freight modelling: a review. Innovations in City Logistics, Nova Science Publishers, New York, pp 197–211
Holguín-Veras J, Jaller M, Destro L, Ban X, Lawson C, Levinson HS (2011) Freight generation, freight trip generation, and perils of using constant trip rates. Transportation Research Record 2224(1):68–81
Palacios-Argüello L, Gonzalez-Feliu J (2016) Assessing the sustainability of urban food systems for collective uses: case study of a French city. In: VREF Conference on Urban Freight 2016: Plan for the future-sharing urban space, p F26
Gonzalez-Feliu J (2018) Sustainability evaluation of green urban logistics systems: literature overview and proposed framework. In Green Initiatives for Business Sustainability and Value Creation (pp. 103-134). IGI Global
Melo S, Costa A (2011) Definition of a set of indicators to evaluate the performance of urban goods distribution initiatives, City Distribution and Urban Freight Transport: Multiple Perspectives. Edward Elgar, Northampton, pp 120–149
Gonzalez-Feliu J, Morana J (2014) Assessing urban logistics pooling sustainability via a hierarchic dashboard from a group decision perspective. In Sustainable Logistics (pp. 113-135). Emerald Group Publishing Limited
Patier D, Browne M (2010) A methodology for the evaluation of urban logistics innovations. Procedia Soc Behav Sci 2:6229–6241. https://doi.org/10.1016/j.sbspro.2010.04.033
Melo S (2012) Evaluation of urban goods distribution initiatives towards mobility and sustainability: indicadors, stakeholders and assessment tools
Morana J, Gonzalez-Feliu J (2015) A sustainable urban logistics dashboard from the perspective of a group of operational managers. Manag Res Rev 38:1068–1085
Gonzalez-Feliu J (2017) Logistique urbaine durable: Evaluation et prévision. ISTE Editi, London
Gonzalez-Feliu J (2013) Multi-stage LTL transport systems in supply chain management
de Oliveira LK, de Albuquerque Nóbrega RA, Ebias DG (2017) Analysis of freight trip generation model for food and beverage in Belo Horizonte (Brazil). Region 4:17–30
Campbell S, Sanchez-Diaz I, Lawson CT, Jaller M, Holguin-Veras J (2012) Comparison between industrial classification systems in freight trip generation modeling
de Dios Ortuzar J, Willumsen LG (2002) Modelling transport.
Hensher DA, Button KJ (Eds.) (2007) Handbook of transport modelling. Emerald Group Publishing Limited
González-Feliu J, Cedillo-Campo MG, García-Alcaraz JL (2014) An emission model as an alternative to OD matrix in urban goods transport modelling. Dyna 81:249–256
Segalou E, Ambrosini C, Routhier J-L (2004) The environmental assessment of urban goods movement. In Logistics Systems for Sustainable Cities: Proceedings of the 3rd International Conference on City Logistics (Madeira, Portugal, 25–27 June, 2003) (pp. 207-220). Emerald Group Publishing Limited
Daganzo CF (2005) Logistics systems analysis. Springer Science & Business Media
Combes F (2016) A theoretical analysis of the cost structure of urban logistics. In Proceedings of the 6th International Conference in Informations Systems, Logistics and Supply Chain (pp. 1-4)
Mancini S, Gonzalez-Feliu J, Crainic TG (2014) Planning and optimization methods for advanced urban logistics systems at tactical level. In Sustainable Urban Logistics: Concepts, Methods and Information Systems. (pp. 145-164). Springer, Berlin
Cattaruzza D, Absi N, Feillet D, González-Feliu J (2015) Vehicle routing problems for city logistics. EURO Journal on Transportation and Logistics 6(1):51–79
Partyka J, Hall R (2010) On the road to connectivity. OR/MS Today 37:42–49
Ackoff RL (1977) Optimization+ objectivity= optout. Eur J Oper Res 1:1–7
Gonzalez-Feliu J, Muñuzuri J, Cedillo-Campos MG, Ambrosini C, Taniguchi E, Chiabaut N (2015) Restrictions d’accès au centre-ville: à la recherche du véhicule optimal urbain. Logist Manag 23:31–44
Groër C, Golden B, Wasil E (2010) A library of local search heuristics for the vehicle routing problem. Math Program Comput 2:79–101
Clarke G, Wright JW (1964) Scheduling of vehicles from a central depot to a number of delivery points. Oper Res 12:568–581
Toth P, Vigo D (Eds.) (2014) Vehicle routing: problems, methods, and applications. Society for Industrial and Applied Mathematics
Golden BL, Raghavan S, Wasil EA (Eds.) (2008) The vehicle routing problem: latest advances and new challenges (Vol. 43). Springer Science & Business Media
Dijkstra EW (1959) A note on two problems in connexion with graphs. Numer Math 1:269–271
Faure L, Burlat P, Montreuil B, Marquès G (2014) A modelling approach of pooled urban consolidation centers. In: 2014 gis urban modeling symposium
Vaghi C, Percoco M (2011) City logistics in Italy: success factors and environmental performance, City Distribution and Urban Freight Transport: Multiple Perspectives. Edward Elgar, Northampton, pp 151–175
François C, Gondran N, Nicolas J-P, Parsons D (2017) Environmental assessment of urban mobility: combining life cycle assessment with land-use and transport interaction modelling—application to Lyon (France). Ecol Indic 72:597–604
Andriankaja D, Gondran N, Gonzalez-Feliu J (2015). Evaluation environnementale d'un centre de distribution urbaine par une approche d'ACV. Logistique & Management, 23(1):51–69
Gkatzoflias D, Kouridis C, Ntziachristos L, Samaras Z (2007) COPERT 4: computer programme to calculate emissions from road transport. European Environment Agency. https://www.eea.europa.eu/publications/copert-4-2014-estimating-emissions/at_download/file
Erdoğan G (2017) An open source spreadsheet solver for vehicle routing problems. Comput Oper Res 84:62–72
Author information
Authors and Affiliations
Contributions
The authors designed the format proposal together. LVPA collected and analyzed the data, contributed to the framework proposed, performed the simulations and drafted the manuscript. FB contributed to the construction of delivery routes for food supply by proposing a set of algorithms that reproduce the calculation algorithms of TMS in ANNONA, and performed the ANNONA simulations. JGF proposed and validated the methodology for the simulation and economic assessment, and addressed its application issues. NG proposed the methodology for the environmental assessment. All authors read, improved and approved the final manuscript.
Corresponding author
Ethics declarations
Competing interests
The authors declare that they have no competing interests.
Publisher’s Note
Springer Nature remains neutral with regard to jurisdictional claims in published maps and institutional affiliations.
Rights and permissions
Open Access This article is distributed under the terms of the Creative Commons Attribution 4.0 International License (http://creativecommons.org/licenses/by/4.0/), which permits unrestricted use, distribution, and reproduction in any medium, provided you give appropriate credit to the original author(s) and the source, provide a link to the Creative Commons license, and indicate if changes were made.
About this article

Cite this article
Palacios-Argüello, L., Gonzalez-Feliu, J., Gondran, N. et al. Assessing the economic and environmental impacts of urban food systems for public school canteens: case study of Great Lyon region. Eur. Transp. Res. Rev. 10, 37 (2018). https://doi.org/10.1186/s12544-018-0306-8
Received:
Accepted:
Published:
DOI: https://doi.org/10.1186/s12544-018-0306-8