- Original Paper
- Open access
- Published:
Comparison of fuzzy-based and AHP methods in sustainability evaluation: a case of traffic pollution-reducing policies
European Transport Research Review volume 5, pages 11–26 (2013)
Abstract
Purpose
In recent years, the debate concerning the concept of sustainability and sustainable development has received increasing attention with reference to interactions between transport and land-use systems. A multi-dimensional vision of sustainable mobility has been accepted as a reference point for stakeholders and experts; it finds a significant representation in the concept of the “three pillars of sustain-ability” which examines the idea of sustainability from a three-dimensional perspective: social, economic and environmental. This paper presents a Fuzzy-Based Evaluation Method (F-BEM), which is a useful tool for evaluating the sustainability of alternative transport policies.
Method
The structure of the method formalises the concept of the “three pillars of sustainability” by means of a set of indicators as input variables. The method determines an overall fuzzy index of the sustainability of each alternative policy analysed and provides information about the combined dimensions of sustainability (equity, viability and bearableness).
Results
In order to analyse the operational applicability and effectiveness of the proposed method, various pollution-reducing policies were evaluated with reference to a case study and compared with the Analytic Hierarchy Process (AHP) method.
Conclusions
Interpretation of results yielded useful information about the capacity of the model to be used as an alternative to traditional methods of sustainability evaluation, and also indicated further developments of this research.
1 Introduction
The concepts of sustainable transport and the more general concept of sustainable development have been widely debated in recent years, finding a common framework in the three-dimensional vision of sustainability.
In 1987, the Brundtland Commission [46] defined sustainable development as a “development that meets the needs of the present without compromising the ability of future generations to meet their own needs”.
Deeper analyses of this concept highlighted the fact that “environmental, economic, and social systems interact to their mutual advantage or disadvantage at various space-based scales of operation” [45]. This multi-dimensional vision must therefore be adopted when dealing with problems concerning sustainability. Looking at the problem from this perspective, a sustainable transport system may be viewed as one which allows “the movement of people and goods by modalities that are sustainable from an environmental, economic and social point of view” [31, 33].
As this concept is particularly complex and difficult to understand, several visual representations have been developed [9, 26], including the so-called “three pillars of sustainability” or the “triple bottom line” (Fig. 1), in which development is bearable (socially and environmentally sustainable), equitable (socially and economically), and viable (environmentally and economically) and hence becomes sustainable/durable. The “three pillars of sustainability” representation highlights the fact that the concept of sustainability itself is the result of interactions among the three dimensions, which overlap and cannot be analysed separately from each other. In practice, various formalisations based on this representation may be developed, in order to assess the sustainability of a given action plan for transport and land-use systems. One option is the use of fuzzy sets and systems theory, which can formalise situations characterised by:

The “three pillars” of sustainable development
-
non-homogeneous variables/quantities;
-
information on a characteristically uncertain and imprecise system (present and future), particularly when judgements expressed by experts are used in the evaluation;
-
interrelations between the dimensions of sustainability which tend to induce ‘overlaps’ (“fuzzy” boundaries).
In this paper, fuzzy sets and systems theory were used to develop a fuzzy-based methodological approach, finally defining an “overall” sustainability index.
The paper is organised as follows. Section 2 presents the existing methodological approaches used for evaluation of sustainability in transport studies. Section 3 describes in detail the architecture of the proposed method. Section 4 describes a case study, and presents a comparative analysis of the proposed method with the AHP application, together with a critical review of the results obtained. Lastly, Section 5 mentions further research developments.
2 Related works
Various approaches have been proposed to evaluate sustainable transport systems. Following the classification recently proposed by Awasthi et al. [3], they are divided in eight categories:
-
1.
Life-cycle analysis (LCA) combines pollution emissions and resources used during the life course of a product in order to calculate some criteria. Originally developed for industrial processes [15], LCA has limited application in the context of transport systems, since it does not take social aspects into account.
-
2.
Cost-Benefit Analysis (CBA) examines the monetary equivalent of all the positive and negative effects of a project alternative, with the aim of minimising the costs related to that alternative. When it is not possible to calculate the monetary value of the advantages or when the realization degree of the result to reach is given, cost effectiveness analysis (CEA) is used. The main difficulty of CBA or CEA concerns the monetary quantification of external and social costs [19, 24].
-
3.
Deeper analysis of project alternatives can involve Environmental Impact Assessment (EIA) [12, 48].
-
4.
Optimisation models, applied in the context of sustainable transport, aim at optimal solutions under the specified constraints of social, economic and environmental objectives [52].
-
5.
In the case of complex systems, System Dynamics Models are useful to describe the relationships between the elements of the system by examining time-varying flows and feedback mechanisms [44].
-
6.
Assessment indicator models define indicators which evaluate the sustainability of a practice or a project [29]. Tao and Hung [44] identified three types of models: composite index, multi-level index and multi-dimension matrix models. Composite index models generate a single index, such as the ecological footprint [5] or the green gross national product. However, evaluation is generally so complex that it requires examination of a series of indicators representing various goals, organised in hierarchies (multi-level index models) or related through complex interactions (multi-dimensional matrix models).
-
7.
The Data Analysis approach uses statistical techniques, such as hypothesis testing or structural equation modelling, to evaluate sustainability.
-
8.
Multi-Criteria Decision Analysis (MCDA) methods represent an ample set of methods, including the well-known Multi-Attribute Utility Function Theory (MAUT) [20], Analytic Hierarchy Process (AHP) [41, 42] and ELECTRE methods [39, 50]. Multi-Criteria Decision Analysis evaluates the alternatives to each criterion and collects criterion outcomes in a decision table (or decision matrix). Alternatives are ranked and the “best” solution on the criteria set is found. As there is generally no alternative which optimises all the criteria at the same time, the methods find a compromise solution. MCDA methods are probably the most common approach used for sustainability evaluation in the transport field.
Despite of their wide use (MCDA in particular), these approaches often appear inadequate. Several authors [1, 8, 11, 32] have pointed out that:
-
information on the system (present and future) is uncertain, imprecise, and often incomplete, as a consequence of the complexity of the system;
-
information about different dimensions of sustainability is measured on different scales;
-
the variables involved in the evaluation cannot be univocally identified with one of the three dimensions of sustainability, causing interrelations (‘overlaps’) among them;
-
there is no clear-cut border between the concepts of sustainability and unsustainability, but rather a fuzzy one.
In this paper, fuzzy sets and systems theory are adopted in order to overcome the above-mentioned limitations, formalising the “three pillars of sustainability” concept in a coherent and intuitive manner. This choice is supported by similar applications in other research fields, such as those by Phillis and Andriantiatsaholiniaina [32] and Andriantiatsaholiniaina et al. [1].
Also in the case of MCDA methods, changes are introduced to deal with the uncertainty that the original formulation can only partially overcome. As regards the AHP method, some major changes are the adoption of fuzzy judgements expressed by experts (Fuzzy AHP [7]) and deeper analysis of the levels of uncertainty associated with those judgements, since it appears unrealistic to assume that decision-makers will have both complete information regarding all aspects of the problem and full understanding of it; see for detail AHP and belief theory [2], AHP with Dempster-Shafer (DS) Theory [4].
3 Method architecture
The methodological approach proposed here represents an evolution of a previous Fuzzy Multi-Level (FML) model [36, 37], obtained by means of various structural changes which introduce simplification, both formal and methodological. The three-dimensional concept of sustainability, in an “exploded” configuration (Fig. 2), is interpreted by a Fuzzy-Based Evaluation Method (F-BEM) which works on three different levels (Fig. 3).

“Exploded” vision of three-dimensional concept of sustainability

Three-level structure of F-BEM
At the first level, there are three fuzzy inference systems (FIS_EC, FIS_EN, FIS_SO), which use environmental (Input EN1, .. Input ENk), economic (Input EC1, .. Input ECk), and social (Input SO1, .. Input SOk) input variables (indicators), respectively. The input variables, described in detail in Section 3.1, are processed by inference rules defined by experts in the field within a focus group [23].
Each FIS produces a corresponding sustainability index (Output EN, Output EC, Output SO), defined on a two-level semantic scale: ‘unsustainable’ and ‘sustainable’ (Fig. 4). The variable domain is subdivided into two parts: values from 0.0 to 0.5 represent the “unsustainable zone”, in which unsustainability is higher than sustainability, and values from 0.5 to 1.0, vice versa, represent the “sustainable zone”, where sustainability is higher than unsustainability. The central value of the domain (0.5) represents the uncertainty of expressing the right judgement, since it has the same Grade of Membership (GoM) at both sustainable and unsustainable level (0.5).

Level 1: output fuzzy variables representing level of sustainability
The rules employed in each FIS are conditional and categorical in nature, so that “ if … then …”, expresses a multi-conditional, approximate reasoning. For example:
-
IF “propensity” is Good AND “reduction in number of accidents” is High,
-
THEN The Action Plan is “socially sustainable”
One formalisation of this rule is shown in Fig. 5, in which the rule is applied with Mamdani’s sum-product inference [28] in order to guarantee monotonicity of output [22].

Level 1: rule activation for evaluating social sustainability according to Mamdani’s method
When current values for the input variables (indicators) are introduced into the FIS, some rules are activated and produce a set of fuzzy outputs representing the level of sustainability in the three dimensions. The fuzzy sets produced by implication are thereafter consolidated into a single-output fuzzy set.
As an example, Fig. 6 shows that the current values of indicators “propensity” (represented by a fuzzy set) and “reduction in number of accidents” (which is a percent value) activate two rules:

Level 1: example of activation of two rules and their aggregation
-
Rule 1 = IF “propensity” is Good AND “reduction in number of accidents” is High, THEN The Action Plan is “socially sustainable”
-
Rule 2 = IF “propensity” is ? AND “reduction in number of accidents” is High, THEN The Action Plan is “socially sustainable”
Since the propensity towards the alternative has a higher grade of membership for membership function “Good” compared with membership function “?”, the social sustainability of the alternative obtained from rule 1 is higher than that obtained from rule 2. Lastly, the sum aggregation consolidates the two fuzzy outputs in the final social sustainability of the alternative.
At the second level (Fig. 3), the fuzzy variables representing the social, environmental and economic sustainability indices (Output EN, Output EC, Output SO) are examined in pairs, in order to obtain the fuzzy index of equity “Output EQ” (social-economic dimension), viability “Output VI” (economic-environmental dimension) and bearableness “Output BE” (social-environmental dimension). This is done by aggregating the fuzzy sets obtained at the previous (first) level. More details about the aggregation operation are given in Section 3.2.
At the third and final level (Fig. 3), the second-level output fuzzy sets become inputs for another aggregation (the various indices are composed according to the technique already explained for the second level) in order to produce the fuzzy index of “overall” sustainability “Output SUST” (social-environmental-economic dimension).
3.1 Indicators
In the F-BEM, the “indicators” associated with each alternative action plans are used to measure the extent to which the stated objectives are achieved (measurement of impact, compared with objectives) with reference to the three dimensions of sustainability. These indicators may also be defined in relative terms, examining their variations compared with the status quo.
The choice of which indicators to adopt is complex, since a large number of indicators have been proposed and applied [16, 25, 40, 51]. A set of indicators for use with sustainability analysis is given in Table 1.
In order to overcome the limitations described in Section 2, such as uncertain and imprecise information on the system, variables belonging to more than one dimension of sustainability, and the absence of a clear-cut border between the concepts of sustainability and unsustainability, the F-BEM examines a fuzzy representation of the indicators. The shape of Membership Functions (MFs) can be chosen according to various methods [21]; in this case, three kinds of fuzzy representation were built with the help of experts (Fig. 7):

Various kinds of fuzzy representation of indicators
-
Semantic Scale with triangular MFs, used to represent the indicator “Reduction of Noise Pollution” (Fig. 7a), from “inadequate” to “high” level;
-
Semantic Scale with triangular MFs, used to represent the indicator defined as the “propensity” of users towards exploiting “a transport service alternative to the existing one” (Fig. 7b).
This indicator considers that the improvement in users' quality of life as a result of the introduction of a new transport service, may be measured indirectly by users’ propensity towards choosing the new service. This propensity is collected by a questionnaire, as part of an SP survey [34], in which interviewees express their “propensity” towards changing the current transport service for a new one on a suitable semantic scale of responses (Fig. 8); the question mark “?” indicates inability to make judgements. Since these expressions of propensity are uncertain (in a subjective sense), the method gathers them in a mathematical framework, based on fuzzy sets and possibility theory [10, 21], consistent with that kind of uncertainty. The semantic scale [34, 35] is formally translated into a set of fuzzy intervals, and the average of the propensities, taken as fuzzy intervals, is calculated as an aggregate measurement of responses. By way of example, Fig. 8 shows the ‘average’ propensities associated with three alternatives (A, B, C) referring to the evaluation domain [36].
Fig. 8 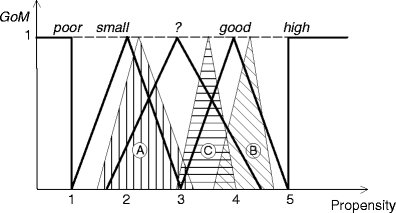
Fuzzy intervals representing “Propensity” of interviewees towards using three transport services (A, B, C) [36]
-
Scale for indicators like “Reduction of CO2 Emissions”, “Reduction of CO Emissions” or “Reduction in number of accidents”: the variation with respect to the status quo is measured on the scale shown in Fig. 7c; the minimum acceptable variation corresponds to the percentage reduction goal fixed by competent government agencies (e.g., a reduction of 20 % in road accidents by the year 2010).

3.2 Aggregation operations
In fuzzy set theory, various kinds of aggregation operations are identified [21, 47]. Formally, each aggregation operation on n fuzzy sets is defined by a function h:

When it is applied to n fuzzy sets A 1 ,A 2 ,…, A n defined on support X, function h produces an aggregate fuzzy set A by operating on the grade of membership of the sets:

A crucial point to note here is that any aggregation operation satisfies the inequalities:

for all n-tuples  .
.
This means that each aggregation operation h expresses a different attitude towards the result calculation, so that choosing it requires particular attention [30, 43]. This fact is easily understood if we look at standard min and max operations, in that inequalities (3) are defined as extreme kinds of aggregation.
With reference to our problem, the use of a standard min operation enables us to describe a conservative decision-maker’s attitude, because the action plan indices of sustainability (equity, bearableness, viability, “overall” sustainability) cannot be larger than the smallest GoM of the first-level ones (economic, social and environmental). Conversely, the standard max operation implies that the second- and third-level indices of sustainability cannot be smaller than the largest GoM of the first-level ones, so that a liberal decision-maker’s attitude is described.
Various aggregation operations (OWA operations, Averaging operations) can cover the interval between the standard min and max, thus modelling intermediate decision-makers' attitudes.
When choosing the most suitable operation the possibility of maintaining the information about the relative importance of each input variable in building the relative sustainability judgement is a valuable criterion: for example, the aggregation operation chosen may indicate that the “equity” of a given action plan can be influenced differently by “social” and “economic” sustainability.
Examining n fuzzy sets A
1
,A
2
,…, A
n
defined on support X, which have GoM a
j
(x) , and a weight vector
  satisfying the condition
  , weighted mean h
w
may be is defined as:
, weighted mean h
w
may be is defined as:

In the authors' opinion, using the weighted mean (or weighted average) as an aggregation operation is considered as an interesting compromise for the proposed method, because the importance of each input variable can be modelled with its corresponding weight. However, other kinds of operations can also be used by decision-makers, in addition to or in substitution of the weighted mean, if they suit their attitudes better (i.e., if they are more or less conservative or liberal).
In the case study described in Section 4, the weighted mean is used to evaluate the measures of sustainability with reference to second- and third-level indices.
4 Case study
The effectiveness of the F-BEM was analysed by comparing it with the well-known AHP method, evaluating differing pollution-reducing policies with reference to a case study.
The area of study is the municipality of Mira, in the province of Venice, with a population of about 38,950 inhabitants (2010), concentrated in Mira and in seven small towns in the same area (density 393,81 inhabitants/km2). The main transport facilities (roads and railways), for both goods and people, are mainly used by traffic from Padova to Venice and vice versa. At the time of the evaluation, about 20 % of commuter trips were made using existing public transport system which consisted of buses travelling along the main road connecting the two cities. Most of the population of Mira commuted by car to and from workplaces or schools (about 60 % of trips), since the public transport system did not cover other areas adequately. Many people used their bicycles or walked (about 10 % of all trips), in particular for journeys inside the municipal area (about 30 % of internal trips).
4.1 Identification of alternative policies
The evaluation process examined a set of three alternative policies:
-
1.
Alternative Urban Transit Service (UTS). A UTS linking the main districts and the railway station, with established bus-stops and timetables and high trip density at peak periods (mornings and evenings). Tickets cost 1.0 Euro per trip (free for people over 75 and those with train or bus passes). The service was provided by buses for 19 passengers. Other characteristics of the service are listed in Table 2.
Table 2 Characteristics of UTS and D-a-R alternatives for a typical weekday -
2.
Alternative Dial-a-Ride service (D-a-R). Customers communicated with the Operations Centre which organised this service, with pick-up points (bus stops) and drop-off points (destination stop, such as train station or public offices) in the municipal territory, and the desired departure or arrival time. Bookings could be made up to 24 h before the bus was due to leave the terminal. The service was performed by bus (capacity 19 people), and the tickets cost the same as those of the UTS. Other characteristics are listed in Table 2.
-
3.
Alternative Even-Odd Plate Number (EOPN). Excluding non-catalysed vehicles and an even-odd number plate rule in the mornings from 8.0 a.m. to 10.0 a.m. and in the evenings from 4.0 p.m. to 7.0 p.m. for catalytic vehicles, two days a week. In the week considered in the analysis, an average reduction of 2.5 % was observed in traffic volumes.
Other differences came to light among the alternatives when the evaluation was performed.
Alternative EOPN was implemented by local authorities after a decision by the regional authority, which coordinated the Even-Odd number plate scheme with neighbouring municipalities. The local authority was responsible for alternative UTS, which was used by those commuting to and from the railway station. Conversely, an alternative D-a-R service was designed but not implemented, with the aim of enhancing existing public transport services, reducing traffic pollution and improving equity among citizens.
The alternative policies were evaluated by both F-BEM and AHP methods and the results were compared, as shown in Fig. 9 and described in the following sections.

Scheme of comparison of Evaluation Processes
4.2 Identification of indicators
Each alternative was evaluated by indicators grouped by type (social, economic, environmental), considering the specificity of the UTS and D-a-R alternatives [14, 27] and paying particular attention to data availability.
The indicators were chosen in order to create a comprehensive representation of each alternative, so that they included the viewpoints of the local authority (“Operating cost”) and of the population (“Propensity towards service”), users (“User cost variation”) and the community as a whole (“Community livability” and environmental indicators).
Table 3 lists the indicators adopted.
4.3 Estimates of performance of alternative policies
The performance of the alternatives for the various indicators was estimated by examining the data for one week in winter (weekdays only; Monday-Friday).
For most indicators, variations in road traffic volumes compared with the status quo (i.e., none of the alternatives was implemented) had to be estimated. A deterministic user equilibrium traffic assignment, with Citilabs Cube®, was carried out to estimate these variations. The indicator “Operating cost” was calculated from estimated variations in traffic volumes according to a kilometric cost representative of each service (number and type of vehicles, drivers), adding personnel costs for implementation (local police officers needed to guarantee observance of EOPN scheme). The indicators “Reduction of CO2 Emissions”, “Reduction of CO Emissions” and “Reduction of Fuel Consumption” were calculated according to emission of polluting substances and consumption factors applied to traffic data, following methods already established in the literature [13]. For the indicator “Reduction of Noise Pollution”, traffic variations on some main roads of interest were translated into noise impact with the Burgess model [6].
The indicator “User Cost Variation” was calculated according to the variation in the user cost associated with the modal shift from private cars to public transport (alternatives UTS and D-a-R). For alternative EOPN, this variation was assumed to be zero, simplifying the various situations which may occur during an EOPN week. For commuter trips, it was reasonable to assume that some people would organise car-pools and some choose public transport to reach their destinations. In the first case, there was an increase in cost (for car owners) due to the longer trips necessary to pick up all passengers (who reduce their own costs). However, although passengers generally compensate car owners for travel, but the amount of these reimbursements is difficult to estimate in detail. In the second case, the final cost depended on trip destination and trip chain performed. The combined effects of both situations were difficult to estimate in detail, and the variation was therefore assumed to be zero.
For non-commuter trips, travellers were assumed not to give up travelling, but rather to shift travel to days in the week when they were allowed to use their own cars. In terms of costs, the final result was that user cost variation was zero.
The indicator “Community livability” was estimated on a qualitative scale by the experts gathered for this analysis, considering the effects of alternatives to the community, with particular attention to non-drivers, the low-income population, and elderly or disabled people.
The indicator “Propensity towards service” (Fig. 10) was estimated by means of a questionnaire as part of an “RP-SP” (Revealed Preferences—Stated Preferences) survey, designed with the aim of collecting information about household activities and transport choices, with particular focus on the propensity towards new transport services. The first part of the questionnaire (“RP” component) gathered general socio-economic information about the interviewees (gender, age, employment) and the characteristics of commuter trips (origin, destination, duration, mode and frequency). The second part of the survey (“SP” component) evaluated the propensity to choose the proposed transport alternative, considering the Compensatory and Non-Compensatory behaviour (SP_C and SP_NC components) of decision-makers.

Average propensity towards alternatives expressed by users on 7-level semantic scale
In the Non-Compensatory part (SP_NC), interviewees explicitly stated the unacceptable levels of the most important attributes of the D-a-R service: booking characteristics (travel planning horizon), fares, and walking distance to bus stops. In the Compensatory part (SP_C), interviewees evaluated their propensity towards the alternative, which satisfied the threshold expressed in the SP_NC part, based on a 7-level semantic scale through a Graded Paired Comparison exercise [38]. Responses were aggregated to obtain the “average” propensity towards a D-a-R service.
The survey was carried out at two moments in time: the questionnaires were first distributed to sample households living in different areas of the municipality, and then interviews were conducted by telephone. About 500 households (3 % of the total) were interviewed, balancing the sample as regards the number and characteristics of the population living in census subareas.
Table 4 summarises the performance of alternatives with reference to each indicator.
In the case of the AHP method, the estimated input data had to be corrected, because the performance of alternatives for some indicators was zero (i.e., calculation of the ratio used by the AHP was not possible) or the evaluation was made by fuzzy sets, as for “propensity”.
In case of zero performance, the experts were asked to compile pair-wise comparison matrices, using verbal judgements corresponding to the performance of the alternatives. Expert Choice™ software translated the comparison judgements according to the 9-point scale of Saaty [41], immediately provided the Consistence Ratio (CR) of each matrix, and calculated normalised performance, aggregating judgements by geometric mean.
As an example, for the indicator “Reduction of Noise Pollution”, the three alternatives had “comparable” performance; for each alternative, the estimated performance was 0.33.
For “propensity” (the only indicator represented by fuzzy sets), because fuzzy sets cannot be considered in traditional AHP, the central value of the MF (the value with the highest GoM) was used.
Table 5 lists the AHP input data.
4.4 Determination of parameters: weights and rules
During the development of both methods, the authors were flanked by a group of five transport system experts and stakeholders, identifying weights and rules of inference.
In the AHP case, the experts were asked (see Section 4.3) to compile pair-wise comparison matrices using verbal judgements. The weights associated with each of them were calculated by Expert Choice™. Table 6 shows the weights estimated through this judgement aggregation.
In the F-BEM case, at the first level experts defined rules concerning sustainability within a focus group [18, 23]. For the other levels, with the weights calculated for AHP (Table 6), Yager’s suggestions [49] were followed.
4.5 Application of analytical hierarchy process
In order to apply the AHP method to the case study, a structure consistent with the three-dimensional vision of sustainability was adopted: the indicators also occur in another part of the structure (Fig. 11) and the weights related to overall sustainability (third level) were calculated as the sum of weights related to each dimension of the second level (see last column in Table 6).

Three-level structure of AHP method
The performance estimated for each alternative led to a correction in the input data used by AHP, as explained in Section 4.3.
4.6 Comparative analysis
4.6.1 Results of analytical hierarchy process
The “overall” sustainability of each alternative can be calculated by multiplying the data of Table 5 (performance) by those of Table 6 (weights). However, the AHP method produces performance alternatives for each dimension (Table 7).
The evaluations resulting from the AHP method may be summarised as follows:
-
first-level dimensions of sustainability: alternative EOPN is best in the environmental dimension, alternative UTS in the economic dimension, and alternative D-a-R in the social dimension;
-
second-level dimensions of sustainability: alternative EOPN is best in terms of bearableness and viability, and alternative D-a-R is best in terms of equity. Alternative D-a-R is also close to alternative EOPN in terms of bearableness;
-
overall sustainability: alternative EOPN is best , followed by alternatives D-a-R and UTS.
The findings of the AHP are easy to understand and, although this is one of the main advantages of the method, it cannot provide information about the absolute level of sustainability reached in each dimension. This shortcoming is not negligible because, in decision-making processes involving sustainability evaluation, a central question is knowing whether an alternative is sustainable to a certain extent, and is not just “more sustainable” than others.
4.6.2 F-BEM results
Interpretation of F-BEM results (Figs. 12, 13 and 14) involved examining the shapes of the fuzzy sets produced as output, that is, the “distribution” of GoMs over the domain. In general terms, the closer the GoM to one, the higher the intensity of expressed judgements, in positive or negative senses. This may be understood by recalling that output domains are included in the range [0.0-1.0], where 0.0 represents the minimum, 0.5 a sufficient or medium level, and 1.0 the maximum in the considered dimension (sustainability, equity, bearableness, etc.). The GoMs of the fuzzy outputs corresponding to the extremes of the domain (GoM(1) and GoM(0)) of Table 8 clarify the results in quantitative terms.

F-BEM Results. First-level performance of alternative policies

F-BEM Results. Second-level performance of alternative policies

F-BEM Results. Third-level performance of alternative policies
As an example, let us consider the “environmental sustainability” of the alternatives (Fig. 12) expressed for each alternative by the corresponding fuzzy set in the domain of the output variable.
Alternatives EOPN and D-a-R are both environmentally sustainable, and EOPN clearly dominates over D-a-R. That is:
-
fuzzy outputs which represent the environmental sustainability of EOPN and D-a-R both plot mainly in the right part of the domain (“sustainable zone”);
-
the EOPN fuzzy set assumes larger GoM values than the D-a-R fuzzy set for the whole domain of the output variable.
Conversely, alternative UTS is unsustainable from the environmental point of view, since:
-
the fuzzy set produced for UTS as output mainly plots in the left part of the domain (“unsustainable zone”).
Looking at these results, some considerations may be made:
-
examination of the fuzzy sets representing the alternatives (Fig. 14) highlights the fact that the alternatives have comparable performance, in the sense that none of them strictly dominates the others;
-
considering the first-level dimensions of sustainability (Fig. 12), alternative EOPN is best in the environmental dimension, alternative UTS in the economic dimension, and alternative D-a-R in the social dimension;
-
considering second-level dimensions (Fig. 13), alternative D-a-R is best in terms of bearableness and equity, and alternative EOPN is best with reference to viability;
-
considering overall sustainability (Fig. 14), alternative D-a-R is best, followed by alternative UTS, which is very close to alternative D-a-R, and alternative EOPN. These results support the idea that D-a-R and UTS may be considered sufficiently sustainable, because the corresponding fuzzy sets are mainly located to the right of the support. Otherwise, alternative EOPN seems to be unsustainable, since its fuzzy set mainly plots left of the support, i.e., in the unsustainability zone.
In this case study, the performance of the alternatives was quite easy to interpret, but in other cases ranking definition may become more difficult: the fuzzy sets obtained at each level for each alternative may be analysed by measuring the possibility/necessity of their mutual dominance in order to define ranking of alternatives [10, 17, 34, 35].
Another solution may be found in the use of the centroid defuzzification method (see [21]). This method defines a synthetic measure representative of the fuzzy set obtained, giving simple information about absolute index level but losing the uncertainty that the use of fuzzy sets guarantees. Table 8 lists the results with reference to the case study.
4.6.3 Comparative analysis
Comparison of the F-BEM and AHP results leads to some considerations:
-
in most of the dimensions, F-BEM and AHP give the same ranking over the alternatives;
-
as regards bearableness and overall sustainability, ranking of the alternatives with F-BEM differs from that produced by AHP. In the former, alternatives D-a-R and UTS perform better (Table 9). In the latter, EOPN is much better from the environmental point of view, and this difference also affects the results in terms of bearableness and overall sustainability. In F-BEM evaluation, the ranking of alternatives obtained in environmental sustainability is the same as that of AHP. However, the differences among alternatives, measured in absolute terms, are less intense and this produces a change in the ranking for bearableness and overall sustainability;
Table 9 Comparison of rankings obtained with AHP and F-BEM methods -
the F-BEM can provide information on the absolute level of sustainability reached in each dimension by the alternatives, unlike AHP, which only ranks the alternatives. From this point of view, the defuzzification method aids readers to understand the results of F-BEM more easily;
-
the F-BEM maintains the uncertainty associated with the indices until the end of the evaluation (there is only a loss of uncertainty in the case of defuzzification).
5 Conclusions
This paper presents a Fuzzy-Based Evaluation Method (F-BEM) for evaluating the sustainability of alternative transport policies. Formalising the concept of the “three pillars of sustainability”, the method determines an overall fuzzy index of sustainability for each analysed alternative policy and provides further information about combined dimensions of sustainability. In order to analyse the operational applicability and effectiveness of the proposed method, a comparative analysis between F-BEM and AHP was made, with reference to different pollution-reducing policies.
Analysis of the results allows us to conclude that, in general terms, the interpretability and simplicity of the F-BEM structure makes it a valuable tool for solving sustainability evaluation problems. It can deal with non-homogeneous indicators, maintaining the kind of uncertainty associated with them and the interrelation between the dimensions of sustainability.
It can also give information about the absolute level of sustainability reached in each dimension by the alternatives, unlike AHP, which only ranks alternatives.
Analysing the results obtained in this case study, both methods show the same ranking over the alternatives, excluding bearableness and overall sustainability. In the F-BEM evaluation, Dial-a-Ride and Urban Transit Service received better evaluations than the “even-odd plate number rule” and may be considered sufficiently sustainable, whereas alternative EOPN seems to be unsustainable.
Since in this case study F-BEM appears to be more robust than AHP, the results obtained should not be considered erroneous. In particular, the preference accorded by AHP to alternative EOPN appears to be strongly influenced by the environmental effects produced by the EOPN rule itself, compared with the others. Unfortunately, this seems to underestimate the social aspects of EOPN, an option which is generally disliked by users and which may induce the phenomenon of social exclusion of some classes of people, such as non-drivers, low-income groups, or elderly or disabled people.
Further developments will focus on testing the sensitivity of the method to changes in its components (e.g., shape of membership functions of indicators, type of aggregation operations) and variations of indicator values, comparing F-BEM with other evaluation methods (e.g., Multi-Objective Analysis) and testing the method on other case studies.
References
Andriantiatsaholiniaina LA, Kouikoglou V, Phillis Y (2004) Evaluating strategies for sustainable development: fuzzy logic reasoning and sensitivity analysis. Ecol Econ 48:149–172
Awasthi A, Omrani H (2009) A hybrid approach based on AHP and belief theory for evaluating sustainable transportation solutions. Int J Glob Environ Issues 9(3):212–226
Awasthi A, Chauhan SS, Omrani H (2011) Application of fuzzy TOPSIS in evaluating sustainable transportation systems. Expert Syst Appl 38:12270–12280
Beynon M (2002) DS/AHP method: a mathematical analysis, including an understanding of uncertainty. Eur J Oper Res 140(1)
Browne D, O’Regan B, Moles R (2008) Use of ecological footprinting to explore alternative policy scenarios in an Irish city-region. Transp Res Part D 13:315–322
Burgess MA (1977) Urban traffic noise prediction from measurements in the metropolitan area of Sydney. Appl Acoust 10:1–7
Buckley JJ (1985) Fuzzy hierarchy analysis. Fuzzy Set Syst 17:233–247
Cornelissen AMG, van den Berg J, Koops WJ, Grossman M, Udo HMJ (2001) Assessment of the contribution of sustainability indicators to sustainable development: a novel approach using fuzzy set theory. Agric Ecosyst Environ 86:173–185
Dalal-Clayton B, Bass S (2002) Sustainable development strategies, 1st edn. Earthscan Publications Ltd, London, p 358
Dubois D, Prade H (1987) Possibility theory. An approach to computerized processing of uncertainty. Plenum Ed, New York
Dunn EG, Keller JM, Marks LA, Ikerd JE, Gader PD, Gosey LD (1995) Extending the application of fuzzy sets to the problem of agricultural sustainability. In: Proceedings of 3rd International Symposium on Uncertainty Modelling and Analysis (ISUMA ’95). IEEE Computer Society, Washington DC, pp 497–502
ECMT (2004) Assessment and decision making for sustainable transport. European Conference of Ministers of Transportation, Organization of Economic Coordination and Development, http://www.oecd.org
EMEP/EEA (2009) Air pollutant emission inventory guidebook 2009, Technical report no. 9/2009, www.eea.europa.eu
Ferreira L, Charles P, Tether C (2007) Evaluating flexible transport solutions. Transp Plan Technol 30(2–3):249–269
Guine JB (2002) Handbook on life cycle assessment. An operational guide to the ISO standard. Kluwer, London, p 704
Haghshenas H, Vaziri M (2012) Urban sustainable transportation indicators for global comparison. Ecol Indic 15:115–121
Henn V (2000) Fuzzy route choice model for traffic assignment. Fuzzy Set Syst 116:77–101
Ibeas A, dell’Olio L, Barreda Montequín R (2011) Citizen involvement in promoting sustainable mobility. J Transp Geogr 19:475–487
INFRAS, CE Delft, ISI, and University of Gdansk (2007) Handbook on estimation of external costs in the transport sector. Report for the European Commission, produced within the study Internalisation Measures and Policies for All External Costs of Transport (IMPACT)
Keeney RL, Raiffa H (1993) Decisions with multiple objectives. Cambridge University Press, Cambridge
Klir GJ, Yuan B (1995) Fuzzy sets and fuzzy logic. Theory and applications. Prentice-Hall PTR, Upper Saddle River
Kouikoglou VS, Phillis YA (2009) On the monotonicity of hierarchical sum-product fuzzy systems. Fuzzy Set Syst 160(24):3530–3538
Krueger RA, Casey MA (2008) Focus groups: a practical guide for applied research, 3rd edn. Sage Publications Inc., Thousand Oaks
Kunreuther H, Grossi P, Seeber N, Smith A (2003) A framework for evaluating the cost-effectiveness of mitigation measures. Columbia University, USA
Litman T (2008) Well measured. Developing indicators for comprehensive and sustainable transport planning. Victoria Transport Policy Institute
Lozano R (2008) Envisioning sustainability three-dimensionally. J Clean Prod 16:1838–1846
Mageean J, Nelson J (2008) The evaluation of demand transport services in Europe. J Transp Geogr 11:255–270
Mamdani EH (1977) Application of fuzzy logic to approximate reasoning using linguistic synthesis. IEEE Trans Comput 26(12):1182–1191
Mori K, Christodoulou A (2012) Review of sustainability indices and indicators: towards a new City Sustainability Index (CSI). Environ Impact Assess Rev 32:94–106
Munda G (1995) Multicriteria evaluation in a fuzzy environment. Theory and applications in Ecological Economics. Physica-Verlag, Heidelberg
Organization of Economic Cooperation and Development (OECD) (1996) Towards sustainable transportation. OECD Proceedings of the Vancouver Conference, OECD
Phillis Y, Andriantiatsaholiniaina LA (2001) Sustainability: an ill-defined concept and its assessment using fuzzy logic. Ecol Econ 37:435–456
Rassafi AA, Vaziri M (2005) Sustainable transport indicators: definition and integration. Int J Environ Sci Technol 21:83–96
Rossi R, Vescovi R, Gastaldi M (2006) Analysis of results from an SP survey on goods transportation choices of manufacturing companies based on the theory of fuzzy sets. In Dry ports, freight depots, logistic centres and competitive development. (In Italian), Venezia, 17 Nov 2005. Aracne Edizioni, Italy, pp 29–44
Rossi R, Vescovi R, Gastaldi M (2007) An application of fuzzy sets and possibility theory to the goods transportation choices of manufacturing companies. Proceedings of 22nd European Conference on Operational Research - Stream: Transportation and Logistics - Invited session, Prague, July 8–11, 2007
Rossi R, Gastaldi M, Vescovi R (2009) A methodological approach to evaluating the sustainability level of a transportation service. Sustain Dev Plan 4(2):411–424, WITPress, ISBN: 978-1-84564-181-8
Rossi R, Gastaldi M, Gecchele G, Vescovi R (2010) Using a fuzzy approach for evaluating sustainability of transportation system pollution-reducing policies: a case study. Proceedings of TRB 89th Annual Meeting, Washington D.C., 10–14 January 2010. CD-ROM
Rossi R, Gastaldi M, Gecchele G (2011) Fuzzy systems approach versus possibility theory approach for representing customers' stated preferences on freight transport services. In: Mussone L, Crisalli U (eds) Transport Management and Land-Use Effects in Presence of Unusual Demand. Selected Papers, vol 1797.38. Franco Angeli, Milan, pp 275–296, ISBN: 978-88-568-4174-9
Roy B, Hugonnard D (1982) Ranking of suburban line extension projects on the Paris Metro System by a multi-criteria method. Transp Res Rec 16A(4):301–312
Russo F, Comi A (2011) Measures for sustainable freight transportation at urban scale: expected goals and tested results in Europe. J Urban Plan Dev 137(2):142–152
Saaty TL (1980) The analytic hierarchy process. McGraw-Hill, New York
Saaty TL (1994) How to make a decision: the analytic hierarchy process. Interfaces 24(6):19–43
Silvert W (1997) Ecological impact classification with fuzzy sets. Ecol Model 96:1–10
Tao C-C, Hung C-C (2003) A comparative approach of the quantitative models for sustainable transportation. J East Asia Soc Transp Stud 5:3329–3344, http://www.easts.info/2003journal/papers/3329.pdf
TRB (1997) Toward a sustainable future; addressing the long-term effects of motor vehicle transportation on climate and ecology. TRB Special Report 251, National Academy Press, Washington, DC
United Nations World Commission on Environment and Development (1987) Our common future. Oxford University Press, Oxford
Vaníček J, Vrana I, Aly S (2009) Fuzzy aggregation and averaging for group decision making: a generalization and survey. Knowl-Based Syst 22:79–84
Wood C (2002) Environmental impact assessment: a comparative review, vol 405, 2nd edn. Prentice-Hall, UK
Yager RR (1978) Fuzzy decision making including unequal objectives. Fuzzy Set Syst 1:87–95
Yu W (1992) ELECTRE Tri: Aspects méthodologiques et manuels d’utilisation. Document de LAMSADE, 74, Université Paris-Dauphine
Zito P, Salvo G (2011) Toward an urban transport sustainability index: a European comparison. Eur Transp Res Rev 3:179–195
Zuidgeest MHP (2005) Sustainable urban transport development: a dynamic optimization approach, PhD Thesis, University of Twente, Enschede. http://doc.utwente.nl/57439
Author information
Authors and Affiliations
Corresponding author
Rights and permissions
Open Access This article is distributed under the terms of the Creative Commons Attribution 2.0 International License (https://creativecommons.org/licenses/by/2.0), which permits unrestricted use, distribution, and reproduction in any medium, provided the original work is properly cited.
About this article
Cite this article
Rossi, R., Gastaldi, M. & Gecchele, G. Comparison of fuzzy-based and AHP methods in sustainability evaluation: a case of traffic pollution-reducing policies. Eur. Transp. Res. Rev. 5, 11–26 (2013). https://doi.org/10.1007/s12544-012-0086-5
Received:
Accepted:
Published:
Issue Date:
DOI: https://doi.org/10.1007/s12544-012-0086-5