- Original Paper
- Open access
- Published:
The impact of automotive industry and its supply chain to climate change: Somme techno-economic aspects
European Transport Research Review volume 5, pages 1–10 (2013)
Abstract
Purpose
The purpose of the present paper is to present and discuss some techno-economic aspects of the impact of the automotive industry and its supply chain to climate change.
Method
In order to provide a well-structured estimate to this global concern nowadays, we will deal with the following: we will clearly define what is meant by climate change and will resume the origins, the extend and the contribution of the automotive vehicles to this phenomenon; we will give an account of the actual world-fleet of vehicles and of the expected increase of this fleet in the forthcoming future, taking into consideration the projected in the future contribution of the world-fleet of vehicles in climate change and of the actions that have been taken by regulation authorities to reduce this phenomenon by limiting the emissions of carbon dioxide (CO2) as well as of other pollutants by newly produced vehicles; we will provide a comprehensive approach of well-to-wheel studies regarding emission and energy consumption mainly performed in the USA, Japan and in the European Union.
Results
The above studies will permit us to evaluate alternative technologies that the automotive industry is considering in order to comply with these regulations and to contribute in reducing the impact of vehicles in the environment and, subsequently, in the climate change.
Conclusions
CO2 equivalent gas emissions of vehicles are expected to increase in the coming years and, consequently, the contribution of the transport sector to climate change will also increase. Battery Electric Vehicles (BEV) constitute the technology to be adopted in order to reduce the contribution of vehicles to climate change. Given the multinational character of the automotive industry and of its suppliers, no major problems will appear in the introduction of new technology vehicles that are conceived to face the environment and climate change problems.
1 Introduction: climate change/Greenhouse effect
Most of the scientists now agree that climate change is due to the Greenhouse effect (GHE), a phenomenon originating from human activities, see for example [1, 2]. It is mainly due to the emission of Greenhouse gases (GHG), in particular CO2 produced by combustion of organic material. GHG absorb and re-radiate back to earth the heat coming from the radiation of the sun provoking climate changes as reported in detail in [3].
The climate change may be scientifically evaluated by considering the changes of the following three parameters during long periods of time:
-
The increase of the global average surface temperature of the earth;
-
The increase of the average sea level of the earth;
-
The decrease of the snow cover of the earth.
In Fig. 1 are presented data, reproduced from the Intergovernmental Panel on Climate Change (IPCC) 2010 official report [4] that resume changes of the above-mentioned three parameters. It can be observed a continuous increase of the global average surface temperature of the earth in the period 1850–2000, a continuous increase of the average sea level of the earth from the year 1870 to 2000 and a continuous decrease of the snow cover of earth’s north hemisphere from the year 1921 to 2000.

Variation with time of the climate factors from year 1961 to year 1990: Global average surface temperature (upper graph), Global average see level (middle graph) and Northern Hemisphere snow cover (lower graph) [4]
In that respect, the relation between CO2 emissions and the climate change is now established. Consequently, the contribution of the emitting CO2 and other gases (evaluated in equivalent CO2) to the climate change can be attributed to each sector of the human activity. This contribution is shown in Fig. 2 [4]. Total emissions of CO2 and of other gases (evaluated in equivalent CO2) were 49 Gt/yr in the year 2004, whilst the contribution of the transport system is 13.1 %, which is equivalent to 6.42 Gt/yr. Note that, this amount is for the whole transport system including emissions from road vehicles, trains, ships and aircrafts.

Total emission of CO2 and equivalent gases and contribution of each sector of human activities to this emission [4]
2 Impact on the automotive industry
Tables 1 and 2 [5] provide an account of the world-fleet of vehicles, the world’s mean value of vehicles per 1,000 inhabitants for the years 2000 and 2010, the number of vehicles constituting the fleet of major countries worldwide and the number of vehicles per 1,000 inhabitants in these countries for the same period, respectively.
In Fig. 3 [6] is shown the projected increase of the world-fleet of vehicles from the year 2000 to the year 2050. It may be noticed that in the year 2032 the fleet will be doubled with respect to the base value of 2000 and by the year 2050 will be tripled (2 million vehicles). This significant projected increase of the total fleet of vehicles is mainly due to the very fast increase of the vehicles fleet in countries showing a very fast development, like China, India and other Asian, Latin American and African countries. Let us point out that, the projected increase of the world fleet considered here [6] is the most conservative one. More recent data [7], published in June 2011, are much more optimistic, estimating that the world fleet of vehicles will number in the year 2050 around 3.2 million vehicles. Given the economic problems encountered by many countries, we consider that we must use the most conservative data and not arbitrarily modify these projected data in order to take into account the recent global economic crisis.

Projected increase of the world-fleet of vehicles [6]
The contribution of the transport sector to equivalent CO2 emissions (13.1 %) mentioned above, is perhaps not significantly high, as compared for example to the contribution of energy supply estimated to 25.9 % (Fig. 2). However, in any case it is alarming, since the projected change of CO2 and equivalent gases emissions due to the transport sector, with respect to base figures of year 2010, presents a significant increase, as shown in Fig. 4 [3], in spite of all measures planned to be taken, whereas in all the other sectors, like energy, industry, agriculture and waste, a significant decrease is projected. This is mainly attributed to:

Projected changes of CO2 equivalent emissions by sector in the European Union, with respect to base year 2010, taking into account the additional measures [3]
-
The constant increase of the world-fleet of vehicles (tripled by the year 2050 with respect to the base figure of 2000).
-
The ageing of these vehicles, which varies from one country to another. Note that, in the rich countries, the average age of the fleet of vehicles does not exceed 5 years and, consequently, the technology level implemented on these vehicles is complying with the most recent European or other equivalent regulations for emissions. But in poor and underdeveloped countries different priorities are set, permitting the use of a fleet of vehicles of an average age around 10–20 years with much higher emission levels.
2.1 Review of the available technologies for an ecological vehicle fleet
It must be pointed out that, it is not enough to replace the thermal vehicles by vehicles that have zero emissions locally in the area of operation, for example electric vehicles. We must also be certain that the chain of production of materials used to manufacture these vehicles and to produce the energy used by these vehicles during their operation life does not contribute to climate change and to pollution of the earth. This problem is certainly the most difficult to face in several countries that do not have the necessary natural resources. Well-to-wheel studies are needed in each country in order to evaluate each one of the new vehicle-technologies with respect to CO2 emissions and energy consumption, given the energy mix used in each country for electric energy production.
The available technologies that have already been or will be introduced into the market to reduce or totally eliminate the contribution of vehicles in the climate change may be listed as:
-
Hybrid Electric Vehicles (HEV)
-
Plug-in Hybrid Electric Vehicles (PHEV)
-
Battery Electric Vehicle with Range Extender (RE-BEV)
-
Battery Electric Vehicles (BEV)
-
Fuel Cell Electric Vehicles (FCEV)
Actually HEV, PHEV, RE-BEV and BEV are already in the market. The FCEV technologies have already been developed and are under evaluation testing. They will be commercialized when the necessary infrastructure will be available to supply them with the appropriate energy.
2.2 Well-to-wheel studies
Evaluation of the suitability of one of the above automotive technologies to reduce emissions and to face climate change problems has been proved by several well-to-wheel studies mostly conducted in the USA, Japan and the EU, which are the major players in the automotive industry [8–11]. However, these studies have not been conducted under the same assumptions and for the same energy mix and, therefore, the results are not the same and their comparison is difficult.
The study of Wang in the Argonne Laboratory [8] provides the latest figures valid for the USA, resumed in Figs. 5 and 7. It can be seen that fuel cell vehicle technology combined with hydrogen production from renewable energy sources is the best technology for our planet environment. But, if the actual USA kWh energy production is considered, it is preferable to use the electric vehicle technology (Fig. 6).

Well-to-wheel data for the USA regarding GHG emissions [8]

Well-to-wheel data for the USA regarding total energy use [8]
Well-to-wheel studies conducted in Japan [9] are presented in Figs. 7 and 8. See, also, the similar studies reported by the EU [10]. It is to be mentioned, however, the important contribution to this problem, i.e. the proprietary software elaborated by Daimler, named OPTIRESOURCE, that permits to analyse any energy pathway for any vehicle’s drive system [11].

Well-to-wheel data for Japan regarding CO2 eq. emissions [9]

Well-to-wheel data for Japan regarding total energy efficiency [9]
The general conclusion of all the well-to-wheel studies presented is that BEV emits less CO2 than any other vehicle when electricity is produced form a low carbon mix and possess the highest energy-efficiency ratio. FCEV are better only if the production of hydrogen is coming from renewable energy sources, which is not possible in all cases. This explains the recent shift in transport policy in USA, deciding to adopt BEV technology and build nuclear stations for energy production. The impact to the automotive industry due to this decision is considerable, because today’s battery-technology does not provide to BEV a range sufficient for the replacement of internal combustion engine (ICE) vehicles. Consequently, the existing RE-BEV technology shall be used. However, improvements are expected in the future, but until then, existing HEV, PHEV and RE-BEV can positively contribute to the environment by lowering GHG emissions by 30–50 %.
2.3 Key-technologies for BEV
The establishment of BEV in the market depends on the distance (kilometers) traveled most of the time by users and also on the following key technologies, briefly outlined below:
-
(i)
Battery technology is the first key-technology for BEV. This is documented by the data presented in Fig. 9 [12], where the specific power of batteries of different technologies is represented as a function of Specific Energy. The target of the industry is a Li-ion battery with specific energy of 240–250 Wh/kg and specific power around 1000 W/kg, whereas, the performance of the existing batteries is approximately half of those figures.
Fig. 9 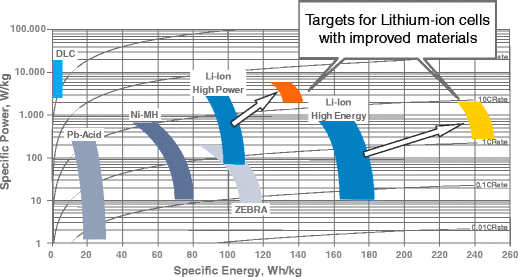
Specific power as a function of specific energy for different battery technologies [12]
-
(ii)
Adequate charging stations networks constitute the second key-technology for BEV. The different types of charging stations used of battery electric vehicles are:
-
Home overnight-charging: 230 V - 10 A - 2.3 kW
-
Home charging: 230 V - 16 A - 3.7 kW
-
Home fast-charging: 230 V - 32 A - 7.4 kW
-
3 phase fast-charging: 3 × 230 V - 32 A - 22 kW
-
3 phase ultra-fast charging: 3 × 230 V - 63 A - 43 kW
-
DC fast charging: 50 kW DC
-
DC ultra-fast charging: 100 kW DC
-
Battery swap
The density of fast- and ultra-fast charging stations is directly related to the battery technology implemented in the vehicles and to the distance (kilometers) traveled daily most of the time; for example, the requirements for Japan are associated with a very dense charging network whereas for Switzerland less dense charging facilities are needed. Note, however, that the real charging time, when using the above mentioned charging stations, is presented in Fig. 10 [13].
Fig. 10 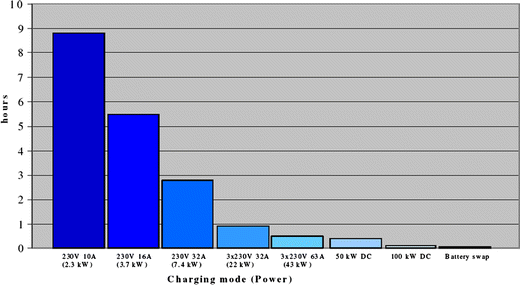
Charging time (hours) for different types of charging stations [13]
-
-
(iii)
Availability of green electric power is the third key technology for BEV. The transport system consumes 38 % of the total energy in the EU. Future road transportation technologies by using BEV are considered by the authorities and the automotive industry. In order to comply with the emissions regulations that have already been issued, it is necessary to considerably increase the percentage of the energy used for transportation from an energy pathway that is not emitting GHG, and, therefore, an adequate electricity-distribution network is needed in this case. It may be pointed out that, if off-pick-hours charging smoothens-out the load on the global electricity network, fast charging during pick-hours may be catastrophic. Also, simultaneous connection of BEV on the electricity distribution network, in order to charge their batteries even during the off-pick-hours, may result in a local breakdown of the distribution network. Consequently we need smart chargers that first sense the load on the local network and then connect new charging-loads. The possibility to use the batteries of vehicles as storage of the electric energy produced by the electricity generation system, smoothening the load on this system, may also be considered.


The contribution of vehicles in climate change cannot be zeroed in a short time, because introduction of vehicles based on new technologies on the world-fleet is done progressively and actually depends on the world economic situation.
A road map for an effective policy to develop during a reasonable time-period can not be the same for all the countries, but it must be adapted to the local conditions and take into consideration the local availability of raw materials, the existing level of technology, the actual energy mix and obviously the local economic conditions. Therefore, the measures expected to be implement in order to face the climate change problem may be listed as:
-
Plan and build an appropriate expansion of the electric power generation and distribution network;
-
Build an adequate network of charging-stations;
-
Position the charging stations in the country so as to maximise the travel range of BEV with today’s battery technology and also predict future improvements in that technology (otherwise money is wasted for charging stations that will not be needed in the future);
-
Provide some incentives to consumers for buying BEV, at a moderate scale so that the market growth rate of BEV is associated with rate of infrastructure building.
2.4 Impact on the international business and trade
The automotive industry is a multinational industry that already has spread their production factories in different continents and in different countries in order to take advantage of the local conditions (raw materials availability, cost of labour, taxation level, simplicity of local administrative requirements by the government, and many more). In Fig. 11 [5] is presented the spread of the automotive industry worldwide.

Production factories of the automotive industry worldwide [5]
Moreover, international cooperation in the production of car components is already a reality. For example, the German Bosch and Toyota are since many years’ co-owners of the two factories producing ABS brake systems in Japan. All car manufacturers have already established international cooperation with the producers of Li-ion batteries in order to secure their supply in batteries for their new technology vehicles. This cooperation is presented in Table 4 [5].
Consequently, implementation of new technologies in the automotive industry is technologically possible and will depend on the price of batteries with respect to the oil price. Li-ion batteries are considered since they constitute the latest and most promising technology. The three alternative scenarios for the battery industry considered are summarised in Fig. 12 [12].

Possible market scenarios until 2015 for HEV, PHEV and BEV [12]
On the other hand, the known reserve and the demand of raw materials used to manufacture Li-ion batteries has a decisive impact on the price of these materials and, finally on the price of the batteries. In Table 3 are tabulated data regarding the three above-mentioned scenarios [12].
Evidently, the distribution of Lithium reserves worldwide, see Fig. 13, would have a great impact on the decision of the automotive industry, but, in reality, the automotive industry and its suppliers are multinational companies, have international collaborations and are not greatly affected by this distribution, see Ref. [12] (Table 4).

Geographical distribution of the known Lithium reserves worldwide [12]. Source: Chemetall - Roskill Information Services Ltd. (2009), R. Keith Evans, Geologist and Industrial Minerals Expert (2009), Garrett – Handbook of Lithium and Natural Calcium Chloride (2004), National research Council (NRC) (1985)
3 Conclusions
Summarising the main features reported above pertaining to the impact of the automotive industry and its supply chain to climate change, the following concluding remarks may be drawn:
-
(a)
CO2 equivalent gas emissions of vehicles are expected to increase in the coming years and, consequently, the contribution of the transport sector to climate change will also increase, because, by the most conservative projections, the world-fleet of vehicles will triple by the year 2050.
-
(b)
Battery Electric Vehicles (BEV) constitute the technology to be adopted in order to reduce the contribution of vehicles to climate change, but, for an effective application of BEV technology in the market, a serious shift to green energy generation may be needed. It is also necessary to provide an effective adaptation of the electricity distribution network in order to handle the loads of the BEV charging, either off-pick or during high demand hours.
-
(c)
Given the multinational character of the automotive industry and of its suppliers, no major problems will appear in the introduction of new technology vehicles that are conceived to face the environment and climate change problems, but the rate of absorption of these vehicles in the market will depend not only on the intensity of the climate changes, but also on the price of batteries with respect to the oil price, as well as on the decisive attitude of the regulations’ authorities. It is to be noted, however, that the recent global economic crisis may greatly affect vehicle sales and the projected constant increase of the ecological vehicle fleet.
References
Houghton J (2009) Global warming: the complete briefing. Cambridge University Press, Cambridge
Kaounides L (2011) Climate Change and the Restructuring of the Word Economy and Trade, Specialist Masters Programmes SMM714, Cass Business School, London, May 2011
Tsoskunoglou M (2010) Facing the climate change introduces a new era for the technological evolution of automobiles. Proceedings of Conference on Electric Vehicles and Ecological transportation, Hellenic Institute for Electric Vehicles, Kalamata/Greece, April 2010
Intergovernmental Panel on Climate Change (IPCC) Report (2010)
Katalog Automobil Revue (2011)
World Business Council for Sustainable Development (WBCSD) Report (2004)
Ward David, Global Trends 2020 and Beyond: automobile use, environment and safety challenges, Paper presented on behalf of the FIA Foundation Report in Autoworld, Brussels 22nd June 2011
Wang M (2003) Well-to-wheels energy and emissions impacts of vehicles/fuel systems: Development and applications of the GREET model. Argonne National Laboratory, California Air Resources Board, Sacramento, CA, April, 2003
Hisashi I (2006) Well-to-wheel efficiency analysis. JHFC, Total Efficiency Study Group, 2006
European Commission (2006) (a) “Well-to-Tank” Report, Version 2b, May 2006, and (b) “Tank-to-Wheel” Report, Version 2b, May 2006
Wind J, Froeschle P, Piffaretti M (2006) Well-to-wheel visualization. Proceedings 22nd Electric Vehicles Symposium (EVS22), Yokohama, Japan, 2006
Fetzer J, Butzmann S, Fink H (2010) Potential and challenges of Li-ion batteries in electrical power trains. Proceedings International Advanced Mobility Forum, Geneva, Switzerland, 2010
Sandmeier P, Felsenstein S (2010) Required infrastructure for electric vehicles by 2020—The Case of Switzerland. Proceedings International Advanced Mobility Forum, Geneva, Switzerland, 2010
Author information
Authors and Affiliations
Corresponding author
Rights and permissions
Open Access This article is distributed under the terms of the Creative Commons Attribution License which permits any use, distribution, and reproduction in any medium, provided the original author(s) and the source are credited.
About this article
Cite this article
Mamalis, A.G., Spentzas, K.N. & Mamali, A.A. The impact of automotive industry and its supply chain to climate change: Somme techno-economic aspects. Eur. Transp. Res. Rev. 5, 1–10 (2013). https://doi.org/10.1007/s12544-013-0089-x
Received:
Accepted:
Published:
Issue Date:
DOI: https://doi.org/10.1007/s12544-013-0089-x