- Original Paper
- Open access
- Published:
Analysis and modelling of performances of the HL (Hyperloop) transport system
European Transport Research Review volume 10, Article number: 41 (2018)
Abstract
Introduction
Hyperloop (HL) is presented as an efficient alternative of HSR (High Speed Rail) and APT (Air Passenger Transport) systems for long-distance passenger transport. This paper explores the performances of HL and compares these performances to HSR and APT.
Methods
The following performances of the HL system are analytically modeled and compared to HSR and APT: (i) operational performance; (ii) financial performance; (iii) social/environmental performance.
Results
The main operational result is that the capacity of HL is low which implies a low utilization of the infrastructure. Because the infrastructure costs dominate the total costs, the costs per passenger km are high compared to those for HSR and APT. The HL performs very well regarding the social/environmental aspects because of low energy use, no GHG emissions and hardly any noise. The safety performance needs further consideration.
Conclusions
The HL system is promising for relieving the environmental pressure of long-distance travelling, but has disadvantages regarding the operational and financial performances.
1 Introduction
The competition between contemporary transport modes has been rather constant over the past decades. However, this has not applied to the European long-distance passenger transport where the airlines have increased their market share substantively. Van Goeverden et al. [1] have estimated that air travel increased by about 45% between 2001 and 2013 while usage of the alternative modes has been rather stable (car, train) or declining (bus). The increasing dominance of air transport has enlarged the environmental impacts of long-distance transport and this trend is expected to continue in the next decades [2, 3]. The aircraft high speed in combination with comparatively low fares particularly those offered by low cost carriers has caused that requirements of travellers have become increasingly demanding, thus leading to a pressure on modes to offer high service quality particularly in terms of the shorter travel times, and low fares. In addition, the environmental impact of transport has gained increasing interest, implying a growing concern with the further dominance of air transport and a demand for more environmental-friendly competitive transport alternatives. This is particularly the case since the current transport modes have been trying to adapt their operational, commercial, environmental, and social performances, though being bounded by their technologies. For these technologies, marginal but not radical improvements have been permanently made. Radical new technologies, which could offer significantly better performances, are still rare and so far have not been able to enter the transport market successfully.
The HL (Hyperloop) system is a new transport technology in conceptual stage that is claimed to provide superior performances to HSR (High Speed Rail) and APT (Air Passenger Transport) system, particularly regarding the travel time, transport costs, energy consumption, and transport safety [4]. So far, studies on HL have focused on enabling technologies of the system such as the electromagnetic levitation [5], the dynamics of the HL vehicle and the infrastructure [6,7,8,9], the implications of the HL for bridge dynamics [10] and the impact of earthquake forces on the HL vehicle [11]. Decker et al. [12] explored the feasibility of the HL system focusing on trades between technical/design aspects and the associated cost. Finally, Janić [13, 14] analysed multiple performances (e.g. operational, economic, social, and environmental) of high-speed rail and compared them to competing modes, without including HL in his analysis though.
Existing studies have not yet systematically explored the HL system’s performances as compared to other transport modes. This paper aims at filling in this gap in the literature by exploring the operational, financial, and social/environmental performances of the HL system and comparing them with those of the HSR and APT system. The results of such comparison are intended to underpin the discussion about the overall feasibility of the HL system.
In addition to this introductory section, the paper consists of four other sections. Section 2 provides a brief description of the considered HS (High Speed) transport systems - already fully operational HSR and APT and still on the conceptual stage HL system. Section 3 deals with an analysis and analytical modelling of the above-mentioned performances of the three systems. Section 4 gives a comparison of the HL system’s performances with those of the HSR and APT. For such purpose, the inputs for estimating indicators of performances of the latter two systems (HSR and APT) are extracted from the existing secondary sources (references). The final Section (5) summarizes the main conclusions regarding the prospective advantages and disadvantages of the HL system and provides some perspectives on its market opportunities.
2 The HS (high speed) transport systems
In this section, we present an overview of the deployment and main technical characteristics of the three high speed transport systems considered in this study: HSR, ART and HL.
2.1 The HSR (high speed rail) system
The HSR systems have been developing worldwide (Europe, Far East-Asia, and USA -United States of America-) as an actually innovative system within the railway transport mode, particularly as compared to its conventional passenger counterparts. The system has had different definitions in the particular world’s regions. For example: In Japan, the HSR system is called ‘Shinkansen’ (i.e., ‘new trunk line’) whose trains can run at the speed of at least 200 km/hr. The system’s network has been built with the specific technical standards (i.e., dedicated tracks without the level crossings and the standardized and special loading gauge). In Europe the HSR system has included infrastructure specially built and/or upgraded for the HS (High Speed) travel and considered to be a part of the Trans-European rail transport system/network. Respecting the maximum speed, the HSR lines have been categorized as Category I (for the speeds equal to or greater than 250 km/h), Category II (those specially upgraded for the speeds of about 200 km/h), and Category III (those upgraded with particular features resulting from the topographical relief or the town-planning constraints). In China, according to Order No. 34, 2013 from the country’s Ministry of Railways, the HSR system has been considered to be the new built passenger-dedicated lines with (actual or reserved) speed equal to and/or greater than 250 km/h along these lines and 200 km/h along the mixed (passenger and freight) lines. In the USA, the HSR system has mainly been considered as that providing the frequent express services between the major population centres on the distances from 200 to 600 mi (mile) with a few or no intermediate stops, at the speeds of at least 150 mph (mi/h) on the completely grade-separated, dedicated rights-of way lines (1 mi = 1.609 km) [14]. Table 1 gives an example of developing the HSR networks round the world.
In addition, Fig. 1 shows the development of the passenger transportation in the European HSR network.
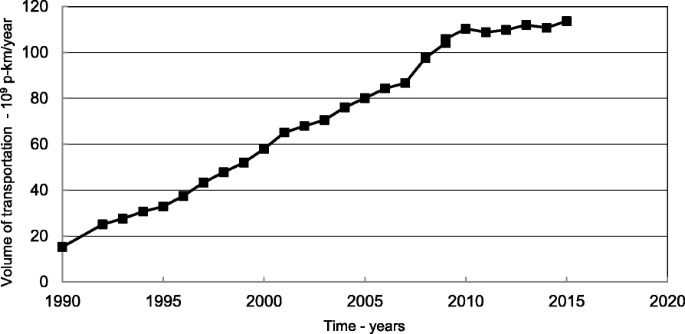
Development of the volumes of passenger transportation in the European HSR network over time (Period: 1990–2015) [34]
As can be seen, the volumes of transportation in terms of p-km have continuously been growing over the specified period of time, which has been possible thanks to expanding the HSR network in particular European countries.
2.2 The APT (air passenger transport) system
The APT has been permanently growing thanks to improving the ‘aircraft capabilities’, the ‘airline strategy’ and ‘governmental regulation’ (Boeing, 1998). The ‘aircraft capabilities’ has related to increasing speed, payload, and take-off-weight. Both the speed and payload have contributed to an enormous increase in the aircraft productivity, for more than 100 times during the last forty years. In particular, increase in the speed has been noticeable over the last six decades as shown on Fig. 2.
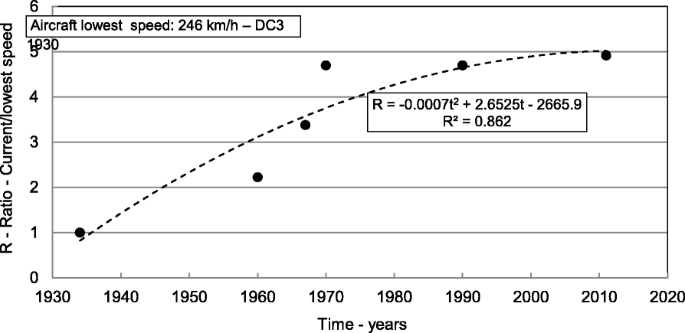
Development of the aircraft speed over time [35]
During the same period, the aircraft seat capacity has increased from 21 to 32 at the aircraft DC3 to almost 600 at Airbus A380. In addition, the ‘airline strategy’ have permanently deployed bigger, faster, safer, and more fuel-efficient aircraft equipped with lower emission and less-noise engines. As well, the aircraft of various sizes have been progressively engaged to efficiently match markets in the different network configurations, route length, and demand density. The ‘governmental regulation’ has mainly been leading towards liberalization of the national and partially international markets. That in USA (1978) and EU (European Union) (1997) are some of the earliest cases. Consequently, the APT system has been growing over time as shown by the examples on Fig. 3.
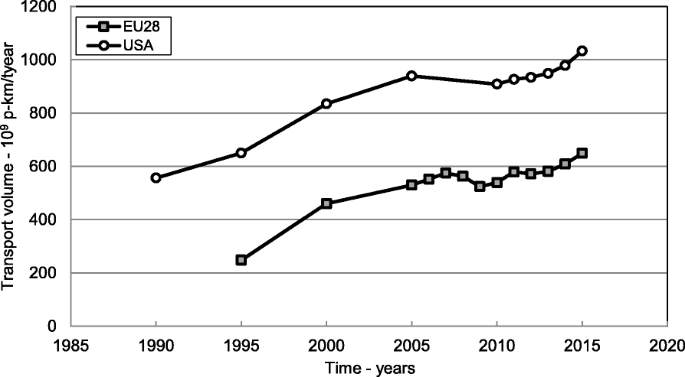
Development of air passenger transport in EU 28 (European Union) and USA (United States of America) over time [34]
As can be seen, in both areas the volumes of air passenger transportation have been generally growing in the long term, with some fluctuations. As well, the volumes of the world’s air passenger transportation have been growing at an annual rate of 4–6% up to about 7 trillion p-km in the year 2015 [15].
2.3 The HL (Hyperloop) system
Historically, several pneumatic and maglev trains similar to HL have been proposed at conceptual level primarily aiming to substantially reduce travel time compared to existing modes, and therefore being adopted in the transport system. For example, in 1910 Robert Goddard designed a floating train on magnets inside a vacuumed tunnel that could reach 250 miles/hour covering the distance between Boston and New York in 10 min. In 1972, RAND suggested that a very high speed transit (VHST) system operating in underground evacuated tubes propelled by electromagnetic waves would be technically feasible to travel coast-to-coast in the US in as low as 21 min [16]. Yet, this report recognized that political feasibility of such project would be very low.
For the purpose of this analysis and modelling its performances, the HL system is assumed to consist of five main components: i) the line/tube including at least two parallel tubes and the stations along them, which enable operations of the HL vehicles in both directions without interfering with each other and embarking and disembarking of passengers, respectively; ii) the fleet of HL vehicles, which can consist of a single and/or few coupled capsules (these are operated by means of a magnetic linear accelerator positioned at the stations, which would accelerate the vehicles/capsules with the support of rotors attached to each of them); iii) the vacuum pumps maintaining the vacuum conditions within the tubes and at the stations at the specified parts; iv) the vehicle control system while operating along the line(s)/tube(s); and v) the maintenance systems for all previous components.
The tubes will be based on elevated pillars except for tunnel sections, while the solar panels above the tubes will provide the system with energy. The ultra-high vacuum approximately at the level of 10− 8 Torr (British and German standards; Torr = Toricheli) would be maintained in the tube (the atmospheric pressure is variable but standardised at the level of 760 Torr or 1.013·105 Pa (Pascal)). Each station of the HL system is to be generally integrated within the tube. It would consist of three modules. The first one is the chamber as a part of the vacuum tube handling the arriving HL vehicle (ultimately ‘arriving’ chamber). After the vehicle enters, de-vacuuming of the chamber is carried out, and the vehicle proceeds to the second module with the normal atmospheric pressure where passengers embark and disembark the vehicle(s). After that, the vehicle(s) passes to the third chamber where at that moment normal atmospheric pressure prevails (ultimately ‘departing’ chamber). Then it spends time until the chamber is de-vacuuming, leaves it, and proceeds along the line/tube. This vehicle handling process takes place at each station of the line. The chambers are separated by the hermetic doors enabling establishing and maintaining the required air pressure in the above-mentioned order.
The capsules would operate in the above-mentioned low-pressure tube(s) on a 0.5–1.3 mm layer of air featuring the pressurized air and the aerodynamic lift as shown on Fig. 4. Under such conditions, they would be able to reach the maximum speed of vmax = 1.220 km/h [4]; the maximum inertial acceleration would be a+ = 0.5 g; g = 9.81 m/s2.

Conceptual design and subsystems of the HL system (source: [4])
The vacuum pumps are installed to initially evacuate and later maintain the required level of vacuum inside the tubes and in the stations’ first and third chambers. In particular, creating vacuum within the tube implies an initially large-scale evacuation of air and later on removal of the smaller molecules near the tubes’ walls using the heating techniques. These pumps would consume a rather substantive amount of energy. At the initial stage, they would operate until achieving the above-mentioned required level of tube vacuum, then, be automatically stopped, and the vacuum-lock isolation gates opened. In cases of air leakage in some section(s), the corresponding gates will be closed and the pumps activated again. The pumps would be located along the tube(s) in the required number depending on the volumes of air to be evacuated, available time, and their evacuation capacity. As far as de-vacuuming and vacuuming of chambers at the stations is concerned, the required number of vacuum pumps will operate accordingly.
Regarding the characteristics of operations within the tube and at the station(s), the control of safe and efficient movement of vehicles and maintaining the vacuum inside the tube and at the station(s) would be provided by the convenient traffic control and management system.
Given the above-mentioned technical features, the HL is envisioned to be a transport mode for the medium- to long-distance travelling. As such, if operating along the routes without substantive physical barriers, it seems to be a good alternative to APT. At present, the HL technology is being tested in practice on the short test tracks with prototype (capsule) models.
Musk [4] considers two variants of the HL system: exclusively for passenger only and mixed for both passenger and freight. The latter has larger dimensions for both the tube and the capsules. For example, the diameter of the tube for the exclusive passenger variant is 2.23 m and for the mixed passenger and freight variant is 3.3 m. The capsules for passengers only are of the standardized seating capacity of S = 28 seats/unit, the mixed passenger and freight variant gives room for 14 passengers and 3 full size automobiles per unit. In particular, those intended exclusively to passengers allow them only to sit since the lack of space for walking through the vehicle(s). In addition, the capsules of both variants lack the toilets, which diminishes the flexibility and applicability of the system because the vehicles would need to stop every 30–60 min for a longer time for toilet visits. The capsules of the passenger and freight variant seem to be sufficiently large to enable walking through the vehicle and to visit a toilet when this is built-in. Their frontal area is supposed to be 4.0 m2 and the height about 1.9 m. The larger dimensions make the system more expensive, but they are essential for its functionality for long-distance travelling. Therefore, our analysis regards the passenger+freight variant with the larger dimensions. Unlike Musk [4], we assume that it is fully utilized for passenger transport and that the seating capacity is equal to the capacity of the small dimensioned passenger only variant: 28 seats per unit. Room for the toilet can be gained by reducing the luggage compartment. The larger dimensions of the vehicles imply that a larger volume for luggage is available per m2 area, and that the seating compartment has more room for storing luggage.
3 Modelling performances of the HL, HSR, and APT system
The development and adoption of transport innovations can be influenced by multiple factors. According to [17] development and adoption of transport innovations is a function of techno-economic, social and political feasibility. If any of those three minimum criteria is not met then the transport innovation will not be adopted. Janic [13] suggests that the performance of a new transport system can be considered in different ways and from the perspectives of different stakeholders involved, i.e., the users/customers, the transport operator, the governmental authorities at different institutional levels, and the society. If the different interests of stakeholders are not successfully balanced, they may block the implementation of a new transport system. In this study, we explore the operational, financial and social/environmental performances of HL that reflect its all feasibility dimensions (see Fig. 5). The performances of its counterparts HSR and APT are considered for the comparative purposes.
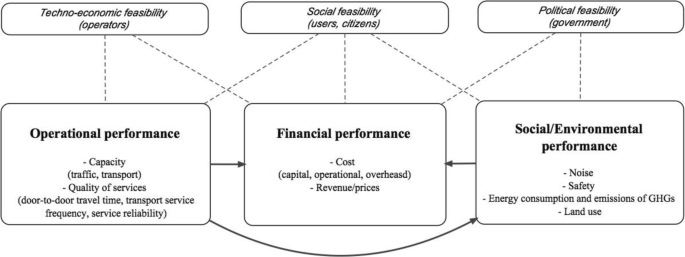
The considered HL, HSR, and APT performances explored in this study
3.1 Operational performance
The operational performance of the HL system generally includes the system capacity and the quality of services. The former is mainly relevant for the operators, and the latter for the users/customers.
3.1.1 Capacity
Similarly to its counterparts, the HSR and APT, the HL system is characterized by its traffic and transport ‘ultimate’ capacity. The ‘ultimate’ capacity is the capacity in the case that everything functions perfectly. In practice, this condition is not met, and the ‘practical’ capacity will be somewhat lower than the ‘ultimate’ capacity.
-
a)
Traffic capacity
The traffic ‘ultimate’ capacity is defined by the maximum number of vehicles, which can pass through the “reference location” for their counting in one direction during a given period of time under conditions of constant demand for service. In case of the HL system, this is actually the capacity of the infrastructure, i.e., stations, segments between the stations, and the line/tube as the whole.
-
i)
Station(s)
The ‘ultimate’ capacity of the station (i) of a given HL line/tube can be ‘static’ and ‘dynamic’. The ‘static’ capacity can be defined by the number of tracks/places at the station. The static capacity that is needed to handle the vehicles of guided transport systems during the given period (T) under conditions of constant demand for service can generally be estimated as follows:
where
- μ i-1 (T) :
-
is the capacity on the (i-1) segment of the line/tube in terms of the maximum transport service frequency during the time period (T) (veh/min or h); and
- τ s/i :
-
is the average time of occupying a track/place at a station (i) by the Hyperloop vehicle (min, h/track).
In the case of the HL system the relation between occupation time and capacity is more complex. The vehicles pass through the three above mentioned chambers, an arriving chamber, a chamber for disembarking and embarking passengers, and a departure chamber. The arriving and departure chambers function as locks. The static capacity is not related to the sum of these occupation times by a vehicle of the three chambers (τs/i), because a) occupation times can overlap (e.g. vehicle 1 can enter the arriving chamber while vehicle 2 is still occupying the platform in chamber 2) –this enlarges the capacity– and b) the arriving and departure chambers are for some time occupied while they are empty (adapting the air pressure for the next vehicle) –this lowers the capacity–. The static capacity of HL can be estimated as:
where
- τ ca/i :
-
is the average occupation time of the arriving chamber of station i for one vehicle (min)
- τ p/i :
-
is the average occupation time of the platform of a station (i) by one vehicle (min).
- τ cd/i :
-
is the average occupation time of the departing chamber of station i for one vehicle (min)
Assuming that the occupation times of the two chambers that function as a lock are equal (τca/i = τcd/i), the equation can be rewritten as:
where
- τ c/i :
-
is the average occupation time of a lock chamber of station i for one vehicle (min)
The meaning of the eqs. 1 to 3 is, that the number of tracks will be sufficient to handle the vehicles when they run at a frequency that equals the segment capacity. This implies that the station capacity will not be critical for the traffic capacity. However, there may spatial or financial limitations for the number of tracks. One should note that a track includes three chambers and each additional track means building three additional chambers. In that case the station capacity can be critical.
The ‘dynamic’ capacity of the station (i) can be defined by the maximum number of HL vehicles, which can be handled at the given number of tracks/spaces at the station (i) during the given period (T) under conditions of the constant demand for service. Based on Eq. 3, this can be estimated as follows:
where all symbols are analogous to those in Eq. 3.
The occupation time of one lock chamber (τc/i) in Eq. 4 can be estimated as follows:
where
- V i :
-
is the spatial volume of the first (‘arriving’) and the third (‘departing’) chamber at the station (i) of the line/tube (i = 1,2,.., N) (ft3 or m3);
- k c :
-
is a binary variable taking the value “1” if a vehicle is in the chamber and the value “0” is the chamber is empty; during the vacuuming and de-vacuuming cycle, both values apply one time;
- V c :
-
is the spatial volume of a vehicle (ft3 or m3);
- P 1i , P 2i :
-
is the initial and final pressure during de-vacuuming and vacuuming the first (‘arriving’) and the third (‘departing’) chamber of the station (i), respectively (mmHg or Pa (Pascals));
- n i :
-
is the number of vacuum pumps at a lock chamber of the station (i);
- C i :
-
is the capacity of a vacuum pump at the first and the third chamber of the station (i) (ft3/min or m3/min); and
- τ 0i :
-
is the average time of opening and closing the lock gates and disembarking and embarking the HL vehicle in the chamber of the station (i) (min).
Under an assumption that the first and the third chamber at each station are of the same volume, this volume of either of them at the station (i) in Eq. 3 can be estimated as follows:
where
- A i :
-
is the area of the vertical profile of the first (‘arriving’) and the third (‘departing’) chamber (m2);
- m :
-
is the maximum number of capsules constituting the HL vehicle per single departure;
- d :
-
is the length of the HL capsule (m);
- B :
-
is the ‘buffer’ distance between the ends of the HL vehicle and the entry and exit door, respectively, of the first and second chamber (m);
- Δ :
-
is the diameter of the chamber (m).
The volume of the vehicle can be estimated as:
where
- A c :
-
is the frontal area of the capsule (m2).
The occupation time of the platform can be described as;
where
- τ ab/i :
-
is the average time that a vehicle stays at the platform for boarding and alighting;
- τ e/i :
-
is the minimum time between leaving a vehicle and entering the next at the platform
-
ii)
Line segment(s)
The ‘ultimate’ capacity of the segment (i-1) in front of the station (i) of a given HL line/tube during the period (T) in Eq. 1 can be estimated as follows:
where
- τ min/i-1 :
-
is the minimum time interval between dispatching successive Hyperloop trains along the (i)-th segment of the line/tube in the single direction (min or h);
- v max/i-1 :
-
is the maximum operating speed of a Hyperloop vehicle on the (i)-th segment of the line/tube (km/h); and
- \( {a}_{\max /i-1}^{-} \) :
-
is the maximum safe deceleration rate of the Hyperloop vehicle on the (i)-th segment of the line/tube (m/s2).
Equation 9 assumes that for safety reasons in each pair of successive HL vehicle(s) moving in the same direction the leading vehicle needs to be separated by at least the minimum breaking distance of the following vehicle.
-
iii)
Line/tube
The line/tube capacity is the traffic capacity of the HL system and is defined as the lowest of the station and segment capacities. From Eqs. 4 and 9, the ‘ultimate’ capacity of a given HL line/tube in the single direction can be estimated as follows:
where all symbols are analogous to those in the previous Eqs.
Eq. 10 indicates that the ‘ultimate’ capacity of a given HL line/tube is determined by the minimum ‘ultimate’ capacity of its (“critical”) segment(s) and/or the station(s). The ‘ultimate’ capacity is higher than the ‘practical’ capacity. The latter can be described as:
where.
- μ(T)* :
-
is the practical traffic capacity;
- U i :
-
is the utilisation rate of the ultimate traffic capacity
-
b)
Transport capacity
The transport ‘ultimate’ capacity of a given HL line/tube can be expressed by the maximum number of offered seats in the single direction during the specified period of time (T). Based on Eq. 10, it can be estimated as follows:
where
- S :
-
is the number of seats per capsule (seats/capsule).
The other symbols are analogous to those in Eqs. 6 and 10.
The practical transport capacity can be described as:
where
- C(T)* :
-
is the practical transport capacity;
- Θ :
-
is the average load factor of the vehicles (the ‘utilisation rate’ of the ultimate vehicle capacity)
For the practical applications, the actual transport service frequency instead of the ‘ultimate’ transport capacity of a HL line/tube in Eq. 10 needs to be considered. This frequency generally depends on the volumes of demand, the HL vehicle’s average seating capacity per departure, and the average preferred load factor as follows:
where
- Q(T) :
-
is the user/passenger demand during the period (T) in single direction (pass/h or pass/day);
The other symbols are analogous to those in Eq. 13.
The meaning of Eq. 14 is that if the frequency is set equal to the practical traffic capacity (μ(T)*), the transport capacity can be superfluous compared to the demand. That could be a reason to provide services with a lower frequency. In that case, the (scheduled) service frequency can in some cases depend on a policy regarding a ‘decency’ transport service frequency.
-
c)
Technical productivity
Multiplied by the average vehicle operating speed along the line/tube the transport capacity gives an estimate of the technical productivity of a HL system under given conditions. From Eqs. 10 and 14, this maximum technical productivity is equal to:
where
- \( \overline{v} \) :
-
is the average speed of the HL vehicle(s) along the line/tube in the single direction (km/h).
The other symbols are analogous to those in the previous Eqs.
One can conclude from Eqs. 11 and 14 that f(T,Q) never can exceed μ(T). Eq. 15 can then be rewritten as:
The average speed (\( \overline{v} \)) of the HL vehicle(s) in Eq. 16 can be estimated as follows:
where
- L :
-
is the length of a given HL line/tube (km); and
- τ :
-
is the average turnaround time of the vehicles/capsules (min)
The other symbols are analogous to those in previous Eqs. (\( L=\sum \limits_{i=1}^{N-1}{l}_i \)).
The technical productivity in Eq. 16 can also be estimated analogously.
-
d)
Fleet size
Based on Eq. 3, the total time, which the HL vehicle(s) would spend at all stations along the line while moving in the same direction, is estimated as:
where
- N :
-
is the number of stations along the line/tube including the begin and end station (terminuses); and
- τ s/1 , τ s/N :
-
is the average time, which the HL vehicle spends at the begin and the end station (terminus), respectively (min/veh).
τs/i is the passing time of a vehicle through the station (see also Eq. 1), This time is equal to:
The other symbols are analogous to those in Eq. 3.
The running time of the HL vehicle(s) along the line/tube in the single direction is estimated as follows:
where
- v max/i :
-
is the maximum operating speed of the vehicle along the (i)- the segment of the line (km/h); and
- \( {a}_i^{-},{a}_i^{+} \) :
-
is the maximum safe deceleration and acceleration rate, respectively, of the HL vehicle(s) on the (i)- the segment of the line (m/s2).
The total turnaround time of the HL vehicle along the line can be estimated based on Eqs. 18 and 20 as follows:
Given the transport ‘ultimate’ capacity of a given line/tube (μ(T)) in Eq. 10 or the transport service frequency in Eq. 14, and the average turnaround time per vehicle (τ) in Eq. 21, the required size of the HL fleet (Total number of capsules) can be estimated as follows:
where all symbols are analogous to those in the previous Eqs.
3.1.2 Quality of services
The quality of services influences (in addition to fares) the attractiveness of the HL system services and as such indicates its relative advantage/disadvantage over the competing modes such as HSR and APT. The relative advantage can be seen as the degree to which an innovation is perceived better than the product it replaces or competes with [18]. The relative advantage has considered to be one of the strongest predictors of the outcome of the decision on whether or not to adopt the innovation. In general, a new transport system does not need to perform better on all aspects, but overall - taking all the relevant characteristics of the service into account - it should offer some added value, i.e., benefits to its users/passengers. In the given context, the attributes of quality service of the HL system such as a) door-to-door travel time; b) transport service frequency; and c) reliability of services are considered relevant for eventual mode/system choice.
-
a)
Door-to-door travel time
The door-to-door travel time consists of the access and egress time, schedule delay (including possible time for luggage checking) at the boarding and alighting stations, in-vehicle time, and the interchange time between different HL vehicles and their particular services at intermediate and end stations.
-
i)
The access and egress time
The access and egress time depends on the interconnectivity between the HL system and the pre- and post-haulage systems, the density of the HL stations, and the speed of the pre- and post-haulage systems (from the users’ doors to the HL station, and vice versa). The access and egress time generally varies at particular HL stations depending on the local spatial and traffic conditions.
-
ii)
The waiting time
The waiting time depends on the frequency of accessible HL services. If there is no limitation on the accessibility, the waiting time is determined by the schedule delay. Based on Eq. 14, the schedule delay can be estimated as follows:
where all symbols are as in the previous Eqs.
In the case of full accessibility and frequent and punctual services, the waiting time will be equal to the schedule delay. If the frequency is lower than 6/h, the average waiting time at the station will tend to be smaller than the schedule delay [19], but then there will be some ‘hidden’ waiting time at the departure location. If seat reservation is obligatory, which is common for long-distance modes, the passengers can use only the service for which they reserved a seat; in that case, the frequency of accessible services is just 1. Particularly in the case of low frequencies, the timetables of connecting scheduled systems as well as risk aversion of travellers for missing the intended service can affect the waiting time.
Low punctuality increases waiting time. The punctuality of the HL system correlates with the homogeneity of successive services (regarding to destination/routing, intermediate stops) and the scheduled buffer times. In the case of a network where some passengers also make interchanges, the policy on whether/how long to wait for the delayed connecting services can additionally affect the punctuality and waiting time.
-
iii)
In-vehicle time and interchange time
The in-vehicle time of the HL system depends on the travel distance, the average speed, and the stopping time at the particular stations.
If the HL system is set up as the network where some travellers also make interchanges within it, the interchange time will depend on the frequency of services, matching the timetables, punctuality, and the policy on waiting for delayed connecting services.
The in-vehicle time and the interchange time correlate with the door-to-door distance. The access/egress and waiting times are ‘fixed ‘times to this respect. The relative values of the latter two time components will decrease when the travel distances increase.
-
iv)
Interchanges
The need to make interchanges generally diminishes the overall quality of service because these may extend travel times and make trips less convenient. In the long-distance travel markets, which the HL system is supposed to penetrate, the users/passengers usually have luggage with them. They generally will have to make at least two interchanges (between the access mode and the HL, and between the HL and the egress mode). In some cases they have to make interchanges within the HL system. The opportunity of interchanges in the access and egress trips is related to the density of HL stations. The opportunity of interchanges within the HL system is related to the design of the HL network.
-
b)
Transport service frequency
The relevance of the service frequency as perceived by the traveller will depend on the envisaged business plan of HL: either as a ‘walk up’ service (i.e. direct access without reservation in advance) or through an advanced obligatory seat reservation. In a scenario with the advanced seat reservation, on the one hand a lower frequency (i.e. 3–4 dep/h) would be well acceptable, while on the other hand the offered service frequency at the time of booking will be lower than the scheduled frequency in the case services are fully booked. In case of ‘walk up’ services the service frequency can also be lower than the scheduled frequency, i.e. when the demand exceeds temporally the offered capacity; then the imbalance between demand and supply will increase waiting times [20].
-
c)
Service reliability
The HL system has two major characteristics that enable a potential high reliability of its services. This is a completely automated system, which as such, per definition, excludes delays due to the human errors. In addition, HL system operates in a closed environment which makes it resilient to the weather conditions. Of course, like any other transport system, the reliability of the HL transport services will depend on the technical reliability of all parts of the system (i.e., capsules, infrastructure, and control system).
Table 2 gives the very preliminary estimates of the above-mentioned indicators of operational performances for three considered systems - HL, HSR, and APT using the above-mentioned analytical models. Mode specific assumptions are presented below the table in the form of notes.
As can be seen, based on the technical characteristics of the HL, its transport service frequency is estimated to be 12 dep/h, which is comparable to that of HSR. In addition, under given conditions, the HL system would perform better than its HSR and APT system counterpart only in terms of the indicator - the total station-station travel time.
The station capacity depends on the choices of pumping capacity and number of tracks. Based on Eq. 5, the pumping capacity for one lock chamber that makes the capacity of the chamber equal to the segment capacity can be calculated. Assuming one track, the required capacity can be described as:
Assuming that the chamber diameter is equal to the tube diameter (Δ = 3.3 m), and that m = 1, d = 30 m, B = 3 m, kc = 0.5 (average of 0 and 1), Ac = 4.0 m2, P1i = 0.74·1.013·105 Pa (Equivalent to the altitude of 2500 m MSL (Middle-Sea-Level)), P2i = 1·10–10 Pa (Ultra High Vacuum), f = 12/h, Ui = 0.8 and τ0i = 1 min, the required pumping capacity is about 5000 m3/min, e.g. 10 pumps (ni = 10) that produce 500 m3/min each (Ci = 500). If more tracks are built, the calculated pumping capacity should be divided by the number of tracks.
3.2 Financial performance
Similarly as at the other transport modes and their systems, the financial performance of the HL system is defined by its revenues, costs, and profits as the difference between the former two. Consequently, the zero profitability achieved by the competitive prices given the costs could guarantee the bottom line for a stable economic viability of the HL system.
3.2.1 Costs
The costs consist of capital costs, operational costs, and overhead costs. The capital costs are the costs for building the infrastructure (tracks, stations), and the costs for purchasing the vehicles. The operational costs regard the cost of maintenance of infrastructure and vehicles, and the costs related to the operation of the vehicles and stations. The overhead costs comprise the capital and maintenance cost of real estate, and the staff costs.
The estimation of the costs of a still not existing system is a rather complex task. Therefore, in the given context, these costs are estimated based on published figures regarding the actual costs of the Maglev-system that are – to a certain extent – comparable to that of the HL system [21].
The cost level is defined by the cost value, currency, and time. One Euro in 2010 reflects a different cost level than either one US Dollar in 2010 or one Euro in 2015. For the sake of comparability, we will convert the figures to Euros of 2015.
-
a)
Capital cost for building tracks
The capital cost for building 1 km of line/tube is likely to depend largely on the local conditions. Building in an empty area on flat sandy soil will be cheaper than building in a highly urbanized area, in moorland, or in mountains. Crossing wide rivers or the need to build tunnels will increase the costs. Musk [4] has estimated the costs of tubes on pylons and tubes in tunnels amounted €10.3 million/km and €34.0 million/km, respectively, for the passenger + freight variant (converted into 2015€).
For the purpose of comparison, there is the example of a high-speed Maglev connection between Shanghai Pudong airport and the outskirts of the city in the form of a dual track of the length of 30 km and two stations (begin and end). Published costs are $1.2 billion and $1.33 billion [22, 23] (2002$US). A possible explanation for the difference is the exclusion/inclusion of the two stations. Both amounts included the purchase cost of the vehicles. Excluding station costs and vehicle costs, the investment costs would have been about €41 million per km track (€2015). Cost estimates for an extension of the line to Shanghai Hongqiao Airport were just the half: about €20 million €/km [24]. A reported reason for the lower costs has been using all-concrete modular design that would reduce the cost by 30%. A second possible reason for the lower cost has been a more solid soil. The current track has been built in an area with seismic activity and weak alluvial soil. This has required the construction on piles, which raised the costs. Another cost estimate of 34 million AU$/km (2008) or 26 million €/km (2015) relates to the proposed Maglev line in the Melbourne area [25]. This estimate is somewhat higher than that for the Shanghai extension. Considering that the cost estimates generally are too low and therefore the Melbourne estimate might be more realistic than the Shanghai estimate, it is assumed that the costs of the Maglev track are in the order of 25 million €/km under favourable conditions.
The costs of 1 km of the HL line/tube will likely be somewhat higher than the cost of Maglev because the latter system does not have the costs for tube construction and the costs for vacuum pumps. On the other hand, the HL does not need the concrete guideway unlike the Maglev. Consequently, it is assumed that the construction costs of the two systems are similar and therefore adopted to be 25 million €/km for the HL system built on solid soil This appears more than double the costs that were estimated by Musk [4] .
Assuming that the actual cost of 40 million €/km for the current Maglev track built on weak soil could have been reduced to about 35 million €/km by using a modular design, the latter figure is adopted for the HL system as well.
The estimated costs for building tunnels at the HL system of 34.0 million €/km [4] can only be compared with the corresponding costs of the railway or road tunnels – the Gotthard base tunnel consisting of two single-track tunnels: 200 million €/km [26]; the Chuo Shinkansen railway line in Japan between Tokyo and Nagoya where 60% of the line goes through tunnels: 160 million €/km [27]; the Channel tunnel between France and Britain of the length of 50.5 km: 4.65 billion £/km (1990) or 190 million €/km (2015) [28]. These figures indicate that the tunnel costs for a double track railway line are in the order of 200 million €/km. This is likely considerably higher than the corresponding costs at the HL system. One of the main reasons is a much smaller diameter of the HL tube – for example, the two single-track Gotthard tunnels with diameters of about 9 m vs a HL tube of 3.3 m. The tunnel construction costs for two HL tubes might then even be somewhat lower than the costs for one single-track rail tunnel. If it is assumed that the costs were underestimated by about a factor 2, just like the argued underestimation for the tube on pylons, the real costs for two parallel tubes would be in the order of 70 million €/km.
-
b)
Capital cost for building stations/terminals
The building costs for a station/terminal were estimated to be about 125 million $US (116 million €). The costs for the two stations of the current Maglev line near Shanghai could be 130 million US$ for two stations (i.e., 77 million €/station), which is significantly lower than the above-mentioned amount [4]. However, the HL system’s stations are more complex than that of the Maglev system because they should give access to vehicles in the evacuated tubes as mentioned above. Therefore, it is assumed that the cost per station of the HL system of €116 million is a fairly good estimate. Stations at nodes of the network where several lines inter-connect will likely be more expensive.
-
c)
Costs of vehicles
The costs for purchase of a vehicle (capsule) were estimated to be about €1.42 million [4]. These are the costs of a vehicle without toilets. Adding a toilet is supposed to increase the costs to about €1.52 million. For the purpose of comparison, the cost of one carriage of a Maglev train with the capacity of 90 seats are €12.5–15 million (compared to the capacity of the HL capsule of 28 seats) [25]. The average unit cost per seat which might be rather comparable are €0.14–0.17 million for the Maglev and €0.054 million estimated for the HL. In the present case, it is assumed that the average unit cost for the HL capsule is 0.17 million €/seat, which is more than the threefold of the above-mentioned estimation by Musk [4]. The assumed cost of a capsule is then €4.8 million.
-
d)
The annual costs
The capital costs discussed above as incidental costs can be calculated as the annual costs (depreciation and interest) as follows:
where
- C b( e) :
-
is the annual capital cost of the cost element e (€/track, station, and/or vehicle);
- C B( e) :
-
is the incidental capital cost of the cost element e (€);
- R e :
-
is the residual value of cost element e (€);
- L t( e) :
-
is the life span of infrastructure element e (years); and
- I t :
-
is the interest rate (%/year).
Table 3 gives an overview of the incidental investment and the annual costs for the HL system. In all cases, it is assumed no residual value (Re= 0) for all cost elements, the interest rate: It = 4%/year, and the life spans as an average used in the EU-countries for the rail and road infrastructure and rolling stock [29].
-
e)
Maintenance costs of infrastructure and rolling stock
For the maintenance costs of the HL lines/tubes, stations, and rolling stock, a fixed ratio to the capital costs is assumed. The World Bank [30] states that the variable component of rail infrastructure cost can vary from just a few percent to about 30% depending on the intensity of use. The HL system is assumed to be heavily used, leading to relatively high maintenance cost, but the ratio to the capital cost will be smaller than for rail because of the lack of physical contact between the vehicles and the infrastructure. Consequently, the ratio of 10% is assumed for both infrastructure and vehicles setting the annual maintenance costs at 10% of the annual capital costs.
-
f)
Operating costs
The operating costs consist of the costs for staff in the vehicles and at the stations, and the traffic management costs. Generally the energy costs for moving the vehicles are also part of the operating costs, but the HL is a special case because it is assumed to take energy from the solar panels at the top of the tube. Some estimates indicate that such produced energy exceeds the energy consumption by the vehicles [4]. The capital and maintenance costs of the solar panels and the transmission of energy to the vehicles are then the only energy costs.
The costs for employees in the vehicles and stations depend on the organization, i.e., the number of employees in the vehicles, and manpower needed for ticket sales and control. In the present context, it is assumed that in each capsule one employee is present checking the seat belts, helping in the case of problems, and possibly providing some food and drink. The staff at stations would include two employees per station controlling and possibly selling tickets, and helping and guiding passengers. Assuming that the average operation time of a capsule is 15 h/day, that stations are opened for 18 h/day, and that the average working time of an employee is 7 h/day (including holiday and sickness absence), the number of full-time employees for a single capsule is 2.14 and for a station 5.14. Assuming an average annual wage of €35,000, the annual operation cost for one capsule would be €75,000 and for a station €180,000. These costs appear to be relatively small compared to the capital cost.
The traffic management costs depend on the intensity of use and the complexity of the network. It is assumed that these costs are equal to the wage of one employee for each 1000 km of ‘double tube’. Assuming an operation time of 18 h per day, 2,57 full employees are needed per 1000 km of the line/tube. The relating annual costs would be €90,000/1000 km, or €90/km.
-
g)
Overhead costs
The overhead costs include the capital and maintenance cost of real estate, and the staff costs. In the present context, it is assumed that the real estate costs are marginal compared to the capital and maintenance costs of the HL infrastructure. As such they are neglected. As far as the staff costs, one overhead employee is assumed per each ten employees needed for operation, these costs are included by increasing the costs of operational staff for 10%.
-
h)
Overview of the costs
Table 4 gives an overview of the annual unit costs of the HL system. At vehicles, the costs are also expressed per seat and seat-km, which makes them comparable to that of other transport systems. For the calculation of numbers per seat km, we assume 28 seats per capsule, 15 operating hours per day per capsule, and an average distance of 600 km per hour in the operating period.
The vehicle cost per seat-km is very low compared to the vehicle costs of other systems. Earlier calculations indicated that these costs ranged from 0.022–0,058 €/s-km (1993€) at different public transport systems in the Netherlands [31]. These costs would be even higher when expressed in 2015€, but public transport provision has become more cost-efficient since. An interesting finding in the study was that the costs are negatively correlated to the speed of a system. The explanation is the fact that most cost components are time related, like the salary of the staff, which lowers the cost per km when the speed increases. Very low costs for the extremely fast HL system could then be expected. An additional explanation is that the energy costs – the only cost component where the per-km cost increases with distance– are not included in the HL vehicle costs.
3.2.2 Revenues/prices
At an economically viable transport system as the HL system intends to be, the average unit price that the users/passengers pay should at least cover the corresponding total average unit cost. These costs depend on the local conditions and the configuration of the system, including
-
Soil condition, natural barriers; the impact is illustrated in Table 4.
-
Average station spacing.
-
Connectivity; this defines together with the station spacing the number of stations per km track that has to be built; in the case of just one line connecting two stations, the number of stations per km at a given station spacing is about two times the number in a large network.
-
Frequency of the services; when the service frequency increases, the infrastructure costs are divided among more services and will be lower per ride.
-
Load factor of the vehicles; this is inversely linearly correlated with the costs per passenger; because of the low transport capacity of the HL (see Table 2) and the high market potential because of the very high speed (even higher than the airplane), generally a high load factor might be expected [32].
The costs for the track infra make up the major part of the costs. This implies a strong relation between service frequency and costs per person km. Figure 6 shows this relation for three types of local conditions, starting from the costs in Table 4. Assumptions are a station spacing of 500 km, a high network connectivity, and a load factor of 80%. The indicated frequencies range from 15 to 216 dep/day/direction, which is the maximum capacity based on the traffic capacity of μ = 12 dep/h (Table 2) under conditions of operation during 18 h/day.

Relation between the average unit costs and transport service frequency
The lowest costs (and the cost-meeting fares) in the figure, in the case of 216 services per day, are €0,30 in the case of solid soil along the whole route, €0,36 in the case of 50% solid soil and 50% weak soil, and €0,40 in the case of 50% solid soil, 40% weak soil, and 10% tunnel. A comparison with the fares of alternative modes is difficult because there is generally a wide range of fares for the same route because of revenue management. Based on the experiences of De Decker [33], the most common fares for high-speed trains would be between €0,15 and €0,25 per km, and those for conventional long-distance trains about half the HSR fares. The fares for low-cost airlines are also significantly lower than the HSR fares.
We remind the reader that the HL cost calculations regard the system with larger dimensions that enables to walk through the vehicles and visit the toilet. These costs could be 20–30% higher than those for a smaller system where passengers only can sit (according to Musk [4] who calculated figures for the two systems). A small-dimensioned system would still be expensive compared to the other long-distance travel modes.
Cost calculations for a still not existing transport system are inevitably highly uncertain. However, the cost calculations produce one strong result: the costs are predominantly determined by the costs for the track infra, and therefore a high service frequency combined with a high load factor is needed for cost-meeting fares that are more or less competitive to those of the alternative transport modes.
3.3 Social/environmental performance
The indicators of the social/environmental performances of the HL system include noise, safety, energy consumption and related emissions of GHGs (Green House Gases), and land use.
3.3.1 Noise
Noise produced by transport vehicles can cause annoyance and harmful effects to people living and/or working close to transport routes. Moreover, traffic noise limits the possible use of space along the routes, and hence may cause an opportunity cost regarding land use. The impact of noise depends on the noise levels at sources, the number of people exposed to them, and duration of the noise exposure. This implies that this performance at the considered systems mainly depends on the routing of transport lines and speed and number of passing by vehicles.
The HL is supposed to hardly produce any external noise affecting relatively close population. This is due to the fact that the HL is not in contact with the tube and therefore there is no transfer of vibration. Any noise from the capsule itself will not be heard outside the tube and the low air pressure inside the tube prevents noise from moving the capsule. The only potential source of noise could be the vacuum pumps, but these are assumed to produce negligible noise [21].
3.3.2 Safety
In evaluating the performance of a transport system a distinction is usually made regarding the internal and external safety. The internal safety relates to risk and damage caused by incidents to the users/operator of the transport system itself. The external safety reflects the possible risk and damage of accidents/incidents to people and their living/working environment outside the systems. The HL system is a dedicated and closed transport system, excluding any kind of interaction with other transport modes and its direct environment. Hence there are no external safety concerns, giving the HL system seemingly an advantage over its prospective counterparts - APT and HSR.
Internal safety benefits are expected because the HL system is a completely automated system and hence excludes the possibility of human errors. In addition the HL system is supposed to be designed according to the fail-safe-principle: in case of danger (e.g., a rapid depressurization in the capsule or tunnel), the “clever” systems will stop the capsule and, if needed, will provide means of individual salvation (e.g., oxygen masks for passengers). However, many safety issues still need further consideration, elaboration and testing, such as for example, evacuation of people, stranded capsules, incorporation of emergency exits, etc. [20].
3.3.3 Energy consumption and emissions of GHGs (green house gases)
The HL system is expected to be less energy demanding compared to the HSR mainly due to having less friction with the track(s) and low air resistance due to the low pressure in the tube. Some preliminary estimates have suggested that the HL system can be about 2–3 times more energy-efficient than the HSR, and depending on transport distances, about 3–6 times more energy-efficient than APT [20]. This is mainly because the HL system is intended to be completely propelled by the electrical energy obtained by the solar panels on top of the tube(s). These are claimed to be able to generate more than the energy needed to operate the system. This also takes into account that sufficient energy can be stored (e.g., in the battery packs on board the vehicles) to operate the system at night, in periods of cloudy weather, and in tunnels [4].
In general, emissions of GHGs are directly related to the energy consumption. If only emissions of GHGs by operations are considered, regarding the above-mentioned primary energy source, the HS system will not make any of them. However, the indirect emissions from building the infrastructure (lines and stations/terminals), rolling stock (capsules), and other equipment should be taken into account in cases of dealing with the system’s life-cycle emissions of GHGs.
3.3.4 Land use
In general, land used to facilitate transport systems cannot, except for underground transportation, be used for other purposes, hence creating an opportunity cost. The valuation of land occupied by the HL system will be a function of the space that is needed (width and length of the infrastructure) and the value of the land. The latter will depend heavily on the specific routing of the line. On the one hand, the HL system is planned to be elevated on pillars, so the effective land occupation on the ground (net area of land needed) can be limited. On the other hand, it remains to be seen if the space between the pillars can be used meaningfully. Moreover, the elevated construction may bring along visual pollution. In general the total amount of land (gross area of land) required for new transport infrastructure can be minimized by maintaining the route as close as possible to the existing transport infrastructure. The HL system’s tubes will be mounted side by side on elevated pillars. For the small tubes – designed for passenger transport only – the size of the pillar that carries two tubes is about 3.5 m wide [21]. The tubes for mixed traffic (passengers and freight) are larger and hence the pillars for these tubes are also expected to be larger, i.e. 5.2 m. Since the pillars will be spaced averagely 30 m and the possibilities to use the space on the ground in between effectively is limited, the net area needed for 1 km of HL system’s line will be about 0.5 ha. The average gross area of taken land by the line is estimated to be about 1.0 ha/km. Despite of more efficient land use of the HL system, it is likely that it will have higher cost of land than, for instance, its HSR counterpart. This is because the HL system is less flexible than HSR system in routing the line particularly in terms of accommodating to the sharp turns.
4 Overview of the indicators of performance
An overview of the estimated indicators of performances of the HL, HSR, and APT systems according to the methodology presented in Sections 3.1 to 3.3 is summarized in Table 5. For those estimations HL, HSR, and APT systems are considered as potential competitors in the medium-distance passenger transport markets(s) of the length of 600 km. Mode-specific assumptions are presented below Table 5 in the form of notes.
As can be seen, some indicators are expressed in quantitative and some others in qualitative terms, the latter based on a relative performance, i.e., relative ranking the transport systems at three levels - low, moderate, and high.
Table 5 demonstrates that the most striking differences between the HL mode and the two other modes regard the vehicle capacity, the vehicle costs per seat km, and the GHG emissions. In all cases, the values are low for HL. The low vehicle capacity results from the assumed short vehicle length. Coupling vehicles would increase the capacity, but moving coupled vehicles through curves might be a technical challenge. Moreover, the chamber lengths have to be increased. The low vehicle costs per seat km can be explained by the extremely high speed (most vehicle costs are correlated with time and not with distance) and the absence of energy costs: the costs for the solar cells are part of the line infrastructure costs. The GHG emissions are low (even zero) because it is assumed that the solar cells provide all energy.
5 Conclusions
Hyperloop (HL) is a new mode of transport that claims to be a competitive and sustainable alternative to the long-distance rail transport (HSR (High Speed Rail)) and the medium-distance APT (Air Passenger Transport) system (less than or equal to 1.500 km). Taking into account that the performance of the HL system can be considered in different ways and from the perspectives of different stakeholders (i.e., passengers, transport operators, government authorities, and society) the operational, financial, social/environmental performances of the HL system have been investigated and evaluated.
In comparing the HL with the HSR and APT system, it has been found that the HL system has relatively positive social/environmental performances, particularly in terms of the energy consumption, emissions of GHGs, and noise. The HL system can potentially be a very safe mode, but both HSR and APT have also a very good safety track record.
A major weak point of the HL system technology appears to be its rather low transport capacity, mainly due to the low seating capacity of individual vehicles/capsules, which affects both the operational and the financial performance. Consequently, the investment costs of HL infrastructure make up a large part of the total costs per seat-kilometre, raising the latter to a higher level than those of its counterparts – HSR and APT. Hence, the break-even fares would also be higher, even if the load factor is relatively high. This finding suggests that HL-application may be limited to the premium passenger transport market, in which there is ‘willingness to pay’ for the strongest feature of HL system service carried out at the very high average speed.
So far, the HL technology is in its infancy and there are still many uncertainties around the system that need further exploration. From operational perspective, an important research issue is if and how the HL system transport capacity could be increased, for instance, by increasing the number seats or coupling several capsules into a single vehicle (‘train’). And also to what extent such change in capacity could influence other operational, financial and socio/environmental performances of the system. An initial study explored the relationship of HL vehicle capacity to total energy consumption and found the former being rather insensitive to the latter (Decker et al., 2017). From financial perspective, further research is needed to more accurately estimate costs associated with HL development especially with respect to infrastructure (i.e. tracks, stations and vehicles) which form the larger part of the total costs per seat-kilometre. Apparently, further specification of these costs requires more research on technological aspects of the system. Finally, from social/environmental perspective, further research is required in exploring the total life-cycle energy consumption and GHGs emissions of the system including infrastructure development (lines and stations/terminals), rolling stock (capsules), and operation of sub-systems such as the vacuum pumps. Moreover, estimation of social performance of the system would be improved by further research on possible implications of HL for social welfare such as accessibility to life-enhancing opportunities and creation of jobs (direct and indirect).
References
Van Goeverden CD, Van Arem B, Van Nes R (2016) Volume and GHG emissions of long-distance travelling by western Europeans. Transp Res D 45:28–47. https://doi.org/10.1016/j.trd.2015.08.009
Lee DS, Fahey DW, Forster PM, Newton PJ, Wit RCN, Lim LL, Owen B, Sausen R (2009) Aviation and global climate change in the 21st century. Atmos Environ 43:3520–3537. https://doi.org/10.1016/j.atmosenv.2009.04.024
European Commission (2014) EU Energy, Transport and GHG Emissions, Trends to 2050, Reference Scenario 2013. Publications Office of the European Union, Luxembourg
Musk E (2013) Hyperloop Alpha. SpaceX, Texas http://www.spacex.com/sites/spacex/files/hyperloop_alpha-20130812.pdf
Abdelrahman AS, Sayeed J, Youssef MZ (2018) Hyperloop transportation system: analysis, design, control, and implementation. IEEE Trans Ind Electron 65(9):7427–7436. https://doi.org/10.1109/TIE.2017.2777412
Braun, J, Sousa, J, Pekardan, C (2017) Aerodynamic design and analysis of the hyperloop. AIAA Journal 55(12):4053-60 https://doi.org/10.2514/1.J055634
Chin, JC, Gray, JS, Jones, SM, Berton, JJ (2015) Open-source conceptual sizing models for the hyperloop passenger pod. 56th AIAA/ASCE/AHS/ASC Structures, Structural dynamics, and materials Conference, Kissimmee, Florida. https://doi.org/10.2514/6.2015-1587
Janzen R (2017) TransPod ultra-high-speed tube transportation: dynamics of vehicles and infrastructure. Procedia Engineering 199:8–17 https://doi.org/10.1016/j.proeng.2017.09.142
Yang Y, Wang H, Benedict M, Coleman D (2017) Aerodynamic Simulation of High-Spee Capsule in the Hyperloop System. In: 35th AIAA Applied Aerodynamics Conference. American Institute of Aeronautics and Astronautics, Reston
Alexander NA, Kashani MM (2018) Exploring bridge dynamics for ultra-high-speed, Hyperloop, trains. Structures 14:69–74 https://doi.org/10.1016/j.istruc.2018.02.006
Heaton TH (2017) Inertial forces from earthquakes on a Hyperloop pod. Bull Seismol Soc Am 107(5):2521–2524 https://doi.org/10.1785/0120170054
Decker K, Chin J, Peng A, Summers C, Nguyen G, Oberlander A, Sakib G, Sharifrazi N, Heath C, Gray JS, Falck RD (2017) Conceptual Sizing and Feasibility Study for a Magnetic Plane Concept. In: 55th AIAA Aerospace Sciences Meeting. American Institute of Aeronautics and Astronautics, Reston
Janić M (2003) Multicriteria evaluation of high-speed rail, Transrapid maglev and air passenger transport in Europe. Transp Plan Technol 26(6):491–512 https://doi.org/10.1080/0308106032000167373
Janić M (2016) A multidimensional examination of performances of HSR (high-speed rail) systems. Journal of Modern Transportation 24(1):1–21 https://doi.org/10.1007/s40534-015-0094-y
AIRBUS (2017) Growing Horizons 2017/2036: Global Market Forecast. AIRBUS, S.A.S, Blagnac Cedex, France
Salter RM (1972) The Very High Speed Transit System. RAND Corporation, Santa Monica
Feitelson E, Salomon I (2004) The political economy of transport innovations. In: Beuthe M, Himanen V, Reggiani A, Zamparini L (eds) Transport development and innovations in an evolving world. Springer, Berlin, pp 11–26
Tidd J, Bessant J, Pavitt K (2001) Managing innovation, integrating technological, market, and organizational change. John Wiley and Sons, Chichester
Weber W (1966) Die Reisezeit der Fahrgäste öffentlicher Verkehrsmittel in Abhängigkeit von Bahnart und Raumlage. Forschungsarbeiten des Verkehrswissenschaftlichen Instituts an der Technischen Hochschule Stuttgart, Stuttgart
Taylor CT, Hyde DJ, Barr LC (2016) Hyperloop commercial feasibility analysis: high level overview. Volpe (US Department of Transport), Cambridge
Wilkinson J (2016) A comparison of Hyperloop performances against high speed rail and air passenger transport using multi-criteria analysis: case study of the San Francisco-Los Angeles corridor. Minor thesis, Delft University of technology, Delft
Antlauf W, Bernardeau FG, Coates KC (2004) Fast track. Civil Engineering, The Magazine of the American Society of Civil Engineers 74(11):37–43
Wikipedia: https://en.wikipedia.org/wiki/Transrapid, assessed 31 October 2016
Wikipedia: https://en.wikipedia.org/wiki/Maglev, assessed 31 October 2016
TKTA: ThyssenKrupp Transrapid Australia (2008) ThyssenKrupp Transrapid Australia submission in response to East West link needs assessment report “Investing in Transport”. ThyssenKrupp Transrapid Gmbh, Kassel
Wikipedia: https://en.wikipedia.org/wiki/Gotthard_Base Tunnel, assessed 31 October 2016
Quora: https://www.quora.com/What-are-the-cost-differences-between-Maglev-and-conventional-high-speed-rail, assessed 31 October 2016
Wikipedia: https://en.wikipedia.org/wiki/Channel_Tunnel, assessed 31 October 2016
Ecorys transport, CE Delft (2005) Infrastructure expenditures and costs, Practical guidelines to calculate total infrastructure costs for five modes of transport, final report. Rotterdam. https://ec.europa.eu/transport/sites/transport/files/themes/infrastructure/studies/doc/2005_11_30_guidelines_infrastructure_report_en.pdf, assessed 31 October 2016
The World Bank (2011) Railway Reform: Toolkit for Improving Rail Sector Performance. The World Bank, Washington
Goeverden V, CD Peeters PM (2006) Suspending subsidies for public transport, its impacts on the public transport system in the Netherlands. 85th annual meeting of the Transportation Research Board, Washington
Van Goeverden CD, Janić M, Milakis D (2018) Is Hyperloop helpful in relieving the environmental burden of long-distance travel? An explorative analysis for Europe. Proceedings international conference on transport, climate change and clean air, Gif-sur-Yvette. https://www.iip.kit.edu/downloads/WCTR_SIGf2_2018_BookOfAbstracts.pdf, assessed 1 July 2018
De Decker K (2013) High Speed Trains are Killing the European Railway Network. Low-tech Magazine 15, http://www.lowtechmagazine.com/2013/12/high-speed-trains-are-killing-the-european-railway-network.html. Assessed 31 Oct 2016.
EC (2017) EU Transport in Figures. Statistical Pocketbook 2017. European Commission. Publications Office of the European Union, Luxembourg, p 164
Janić M (2007) The sustainability of air transportation: quantitative analysis and assessment. Ashgate Publishing Company, Farnham
EEC (2015) Standard Inputs for EUROCONTROL Cost-Benefit Analyses. Edition Number: 7.0 Edition Date: November 2015. European Organisation for the Safety of Air Navigation (EUROCONTROL), Brussels
UIC (2010) High speed rail: fast track to sustainability. International Union of Railways, Paris, France, http://www.hsr.ca.gov/docs/about/business_plans/BPlan_2012LibraryCh7FastTrack.pdf. Accessed 1 Apr 2017.
ICAO (2016) Carbon Emissions Calculator, https://www.icao.int/environmental-protection/CarbonOffset/Pages/default.aspx. Accessed 1 Apr 2017.
Acknowledgements
A previous version of this paper was presented at the BIVEC/GIBET Transport Research Days 2017 in Liege, Belgium.
Author information
Authors and Affiliations
Contributions
DM conceived the research concept and wrote the theoretical and historical background to the subject and the directions for future research. DM, MJ, KVG and RK designed the study. MJ described the HSR and APT systems and analysed the operational performance of HL. KVG analysed the financial performance of HL and contributed to the analysis of HL capacity. RK analysed the social and environmental performance of HL. All authors read and approved the final manuscript.
Corresponding author
Ethics declarations
Competing interests
The authors declare that they have no competing interests.
Publisher’s Note
Springer Nature remains neutral with regard to jurisdictional claims in published maps and institutional affiliations.
Rights and permissions
Open Access This article is distributed under the terms of the Creative Commons Attribution 4.0 International License (http://creativecommons.org/licenses/by/4.0/), which permits unrestricted use, distribution, and reproduction in any medium, provided you give appropriate credit to the original author(s) and the source, provide a link to the Creative Commons license, and indicate if changes were made.
About this article

Cite this article
van Goeverden, K., Milakis, D., Janic, M. et al. Analysis and modelling of performances of the HL (Hyperloop) transport system. Eur. Transp. Res. Rev. 10, 41 (2018). https://doi.org/10.1186/s12544-018-0312-x
Received:
Accepted:
Published:
DOI: https://doi.org/10.1186/s12544-018-0312-x